Market Wrap: Stocks, Bonds, Commodities
Wall Street equity indexes closed higher on Monday as some investors bet that August data would show easing US inflation while others were encouraged by news that Ukraine had made progress against Russia in a war that has hurt the global economy.
The Dow Jones Industrial Average rose 229.63 points to 32,381.34, the S&P 500 gain 43.05 points to 4,110.41 and the Nasdaq Composite add 154.10 points to 12,266.41.
MSCI’s index of Asia-Pacific stocks outside Japan is ascend 0.69% to 630.77 levels. Australian index higher 0.65% to 7,009.70. Japanese Nikkei Index ascend 0.26% to 28,614.63.
European stocks were positive on Tuesday, with the Stoxx Europe 50 Index rose 0.43% to 3,662.35, Germany’s DAX ascend 0.32% to 13,444.06, and France’s CAC add 0.60% to 6,371.83, and U.K.’s FTSE 100 surged 0.12% to 7,482.03.
Benchmark 10-year U.S. Treasury fell as demand for safe assets ascend again, today 10-year bond yields a negative 1.09% to 3.3250.
Oil prices rose in volatile trade on Tuesday as worries about tight fuel supplies ahead of winter offset investor concerns about lower demand in China, the world’s biggest crude importer, and further increases in U.S. and European interest rates.
Spot Brent crude oil add 1.05% to $95.00 per barrel. US West Texas Intermediate crude is up 1.07% to $88.72 a barrel.
The yellow metal gold is decline 0.36% to 1,734.25 dollars per ounce.
Market Wrap: Forex
The U.S. dollar edged lower in early European trade Tuesday ahead of the release of the hotly anticipated U.S. inflation data, which is likely to set the tone ahead of next week’s Federal Reserve meeting.
Today, the U.S. dollar index measures the Greenback against a trade-weighted basket of six major currencies, which is fell 0.28% to 107.790.
The Euro US Dollar (EUR/USD) is a widely traded pair that is up 0.25% today. This left the pair trading around $1.01450.
The Japanese yen was positive against the U.S. dollar on Tuesday as the stock up. Today USD/JPY is drop 0.34% to 142.340 level.
Another commodity-related currency positive against the U.S dollar, AUD/USD surged 0.02% to 0.68880, and NZD/USD up 0.06 to 0.61390 level.
EUR/USD Intraday: Trend on the upside
Our pivot point is at 1.01230
Preferable Price Action: Take buy positions above pivot level with targets at 1.02480 & 1.03370 in extension.
Alternative Price Action: Below pivot looks for a further downside to 1.00170 & 0.99380.
Comment: RSI above 50 levels and Pairs above 55MA.
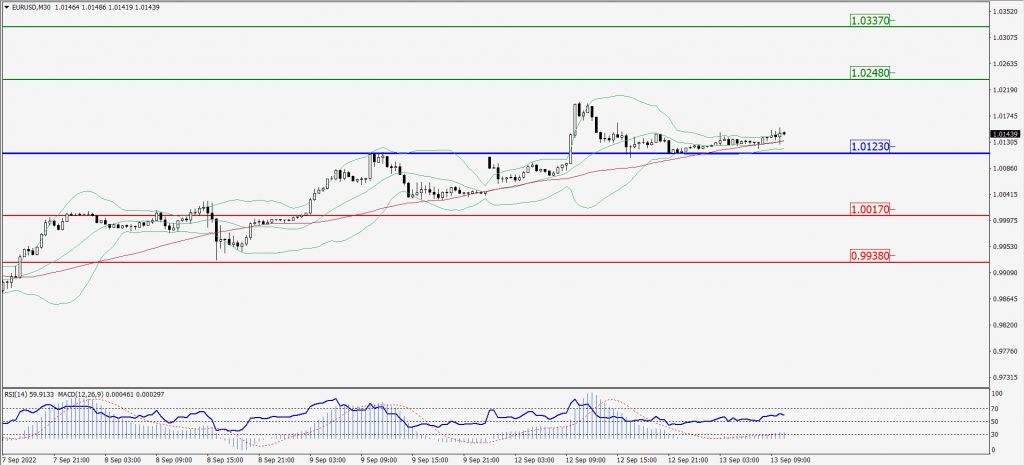
Green Lines Indicate Resistance Levels – Red Lines Indicate Support Levels
Light Blue is a Pivot Point – Black represents the price when the report was produced
GBP/USD Intraday: Support level at 1.16910
Our pivot point is at 1.16910
Preferable Price Action: Buy positions above pivot with targets at 1.18060 & 1.19020 in extension.
Alternative Price Action: The price below pivot would call for further downside to 1.15950 & 1.15050.
Comment: RSI above 50 levels and Pairs above its 20MA & 55MA.
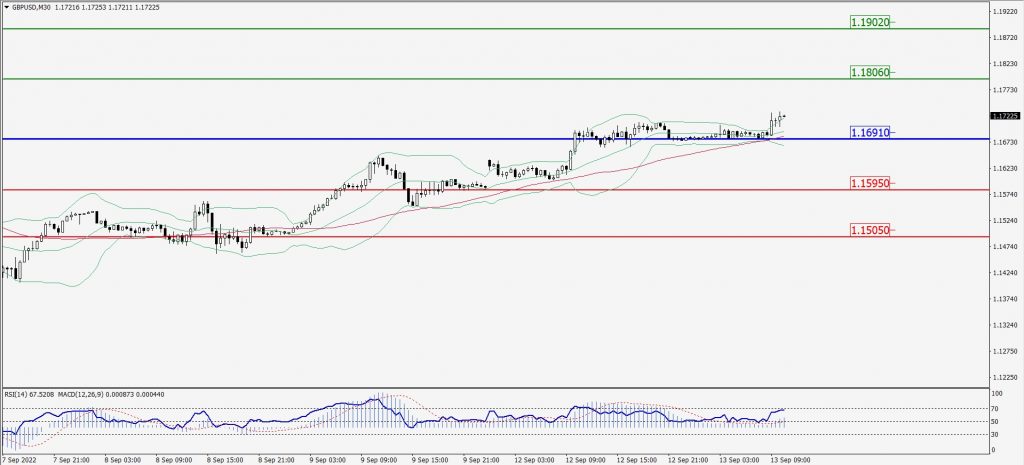
Green Lines Indicate Resistance Levels – Red Lines Indicate Support Levels
Light Blue is a Pivot Point – Black represents the price when the report was produced
USD/JPY Intraday: Resistance level at 142.700
Our pivot point is at 142.700
Preferable Price Action: Sell position below pivot with the target at 141.450 and 140.430 in extension.
Alternative Price Action: The upside breakout of the pivot would call for 143.930 and 144.790.
Comment: MACD is negative territory and Pairs below its 20MA & 55MA.
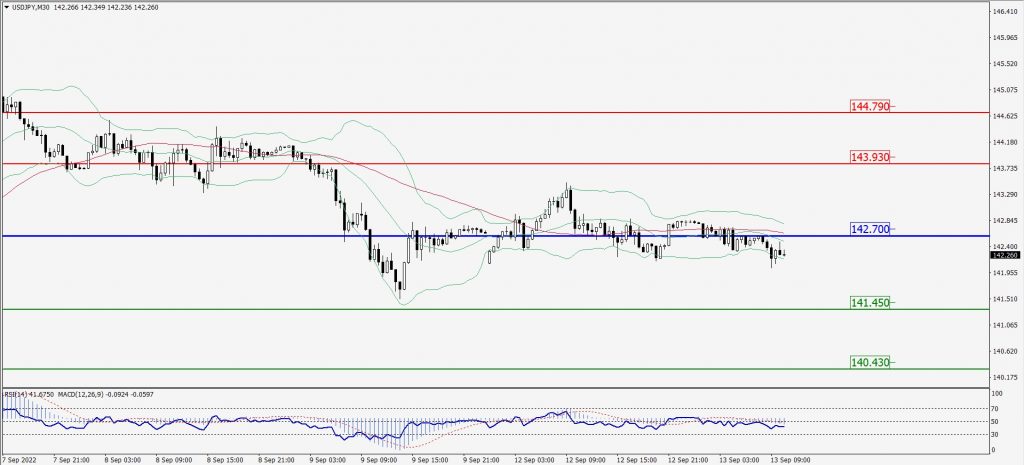
Green Lines Indicate Resistance Levels – Red Lines Indicate Support Levels
Light Blue is a Pivot Point – Black represents the price when the report was produced
AUD/USD Intraday: Trend on the upside
Our pivot point is at 0.68720
Preferable Price Action: Buy Positions above pivot with targets at 0.69440 & 0.70070 in extension.
Alternative Price Action: Below pivot looks for a further downside with 0.68140 & 0.67640 as targets.
Comment: RSI above 50 levels and Pairs above its 20MA & 55MA.
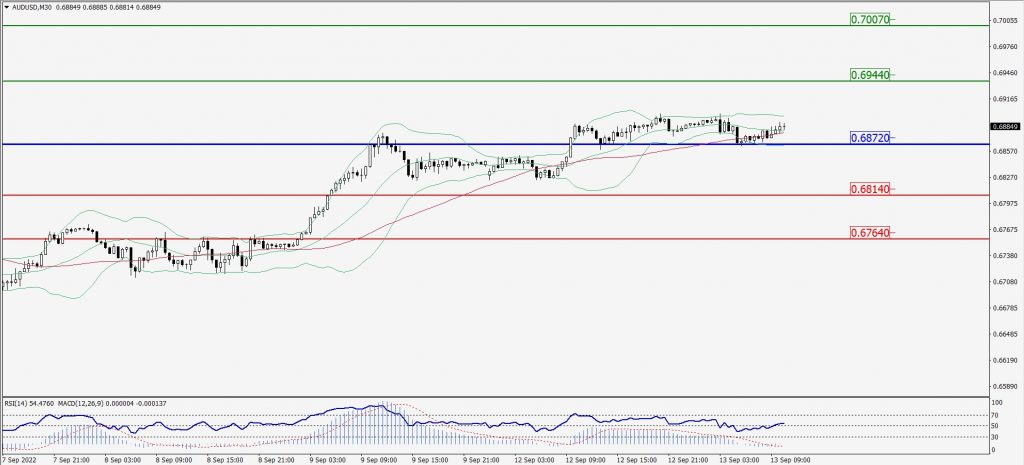
Green Lines Indicate Resistance Levels – Red Lines Indicate Support Levels
Light Blue is a Pivot Point – Black represents the price when the report was produced
CRUDEOIL Intraday: Support level at 87.65
Our pivot point is at 87.65
Preferable Price Action: Above pivots buy oil with 90.57 & 92.75 as targets.
Alternative Price Action: Sell crude below pivot with targets at 84.75 and 82.50 in extension.
Comment: MACD is in the positive territory and Pairs above its 20MA & 55MA.
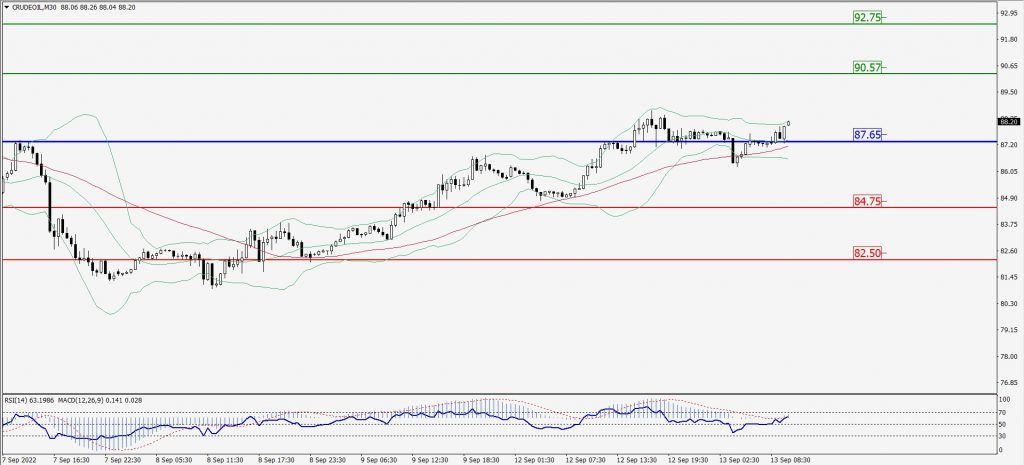
Green Lines Indicate Resistance Levels – Red Lines Indicate Support Levels
Light Blue is a Pivot Point – Black represents the price when the report was produced
XAU/USD Intraday: Trend on the upside
Our pivot point is 1722.70
Preferable Price Action: Further upside to 1739.40 and 1750.60
Alternative Price Action: If the price gives a downside breakout of a pivot, then the price extends to 1708.00 and 1697.10.
Comment: MACD is positive territory and Pairs above 20MA.
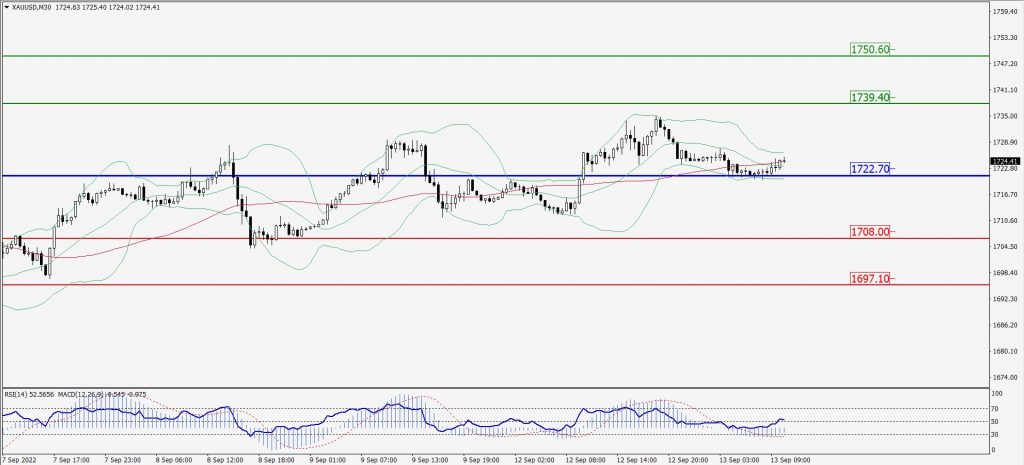
Green Lines Indicate Resistance Levels – Red Lines Indicate Support Levels
Light Blue is a Pivot Point – Black represents the price when the report was produced
Dow Jones Intraday: Support level at 32,413.00
Our pivot point is 32,413.00
Preferable Price Action: Take buy positions above pivot with targets at 32,846.00 & 33,137.00.
Alternative Price Action: Below 32,413.00 looks for further downside to 32,046.00 & 31,743.00.
Comment: RSI above 50 levels and Pairs above its 20MA & 55MA.
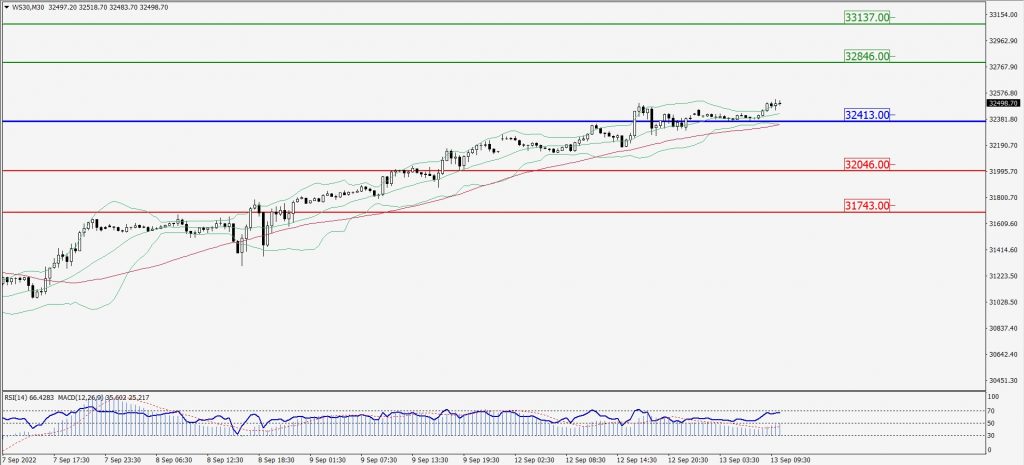
Green Lines Indicate Resistance Levels – Red Lines Indicate Support Levels
Light Blue is a Pivot Point – Black represents the price when the report was produced