Market Wrap: Stocks, Bonds, Commodities
US stocks closed at fresh highs of the year on Tuesday, after inflation data did little to alter views for the timing of a rate cut by the Federal Reserve, as investors awaited the central bank’s last policy decision of the year on Wednesday.
The Dow Jones Industrial Average rose 173.01 points to 36,577.94, the S&P 500 gain 0.46% to 4,643.70 and the Nasdaq Composite add 100.91 points to 14,533.40.
MSCI’s index of Asia-Pacific stocks outside Japan is decline 0.65% to 609.49 levels. The Australian index was higher by 0.31% to 7,257.80. Japanese Nikkei Index ascend 0.25% today.
European stocks were positive on Wednesday, with the Stoxx Europe 50 Index rose 0.29% to 4,549.85, Germany’s DAX ascend 0.17% to 16,820.95, and France’s CAC advance 0.35% to 7,569.79 and U.K.’s FTSE 100 add 0.32% to 7,567.24.
Benchmark 10-year U.S. Treasury fell as deman for safe assets ascend again, today 10-year bond yields negative 0.34% to 4.1930.
Oil prices fell more than 3 percent on Tuesday to their lowest level in six months on concerns of oversupply and after US economic data showed an unexpected rise in consumer prices.
Spot Brent crude oil drop 0.25% to $73.12 per barrel. US West Texas Intermediate crude is down 0.15% to $73.13 a barrel.
The yellow metal gold is advance 0.17% to 1,996.35 dollars per ounce.
Market Wrap: Forex
The dollar ticked up slightly on Wednesday as traders prepared for the conclusion of a Federal Reserve policy meeting that could offer some insight into when the U.S. central bank will begin lowering interest rates.
Today, the U.S. dollar index measures the Greenback against a trade-weighted basket of six major currencies, which surged 0.05% to 103.512.
The Euro US Dollar (EUR/USD) is a widely traded pair that is down 0.02% today. This left the pair trading around $1.07900.
The Japanese yen was negative against the U.S. dollar on Wednesday. Today USD/JPY is surged 0.22% to the 145.750 level.
Another commodity-related currency negative against the U.S dollar, AUD/USD fell 0.03% to 0.65570, and NZD/USD sliped 0.54% to 0.60980 level.
EUR/USD Intraday: Resistance level at 1.07930
Preferable Price Action: Take sell positions below pivot level with targets at 1.07700 & 1.07570 in extension.
Alternative Price Action: Above pivot looks for a further upside to 1.08130 & 1.08260.
Comment: RSI is below 50 levels and Pairs below 55MA.
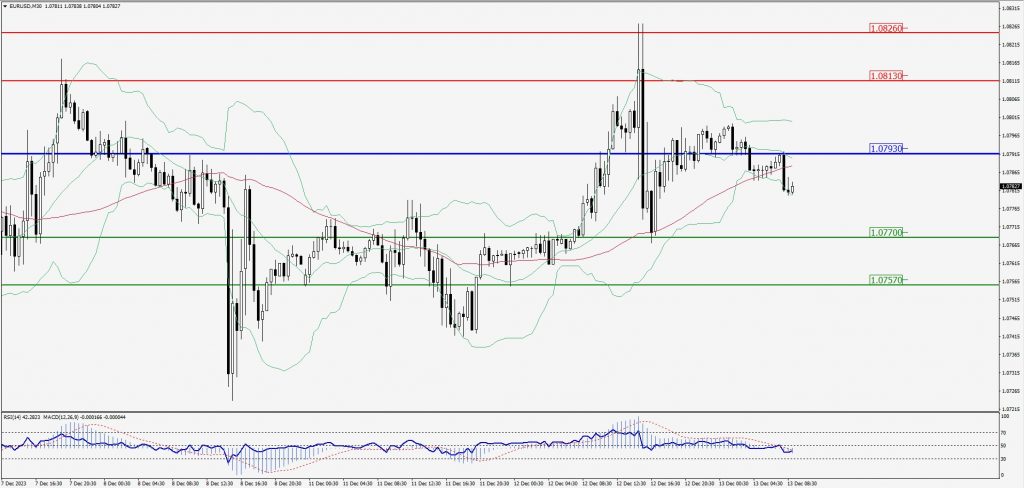
Green Lines Indicate Resistance Levels – Red Lines Indicate Support Levels
Light Blue is a Pivot Point – Black represents the price when the report was produced
GBP/USD Intraday: Major trend on the downside
Our pivot point is at 1.25370
Preferable Price Action: Sell positions below pivot with targets at 1.25120 & 1.25000 in extension.
Alternative Price Action: The price above pivot would call for further upside to 1.25560 & 1.25710.
Comment: RSI is below 50 levels and Pairs below its 20MA & 55MA.
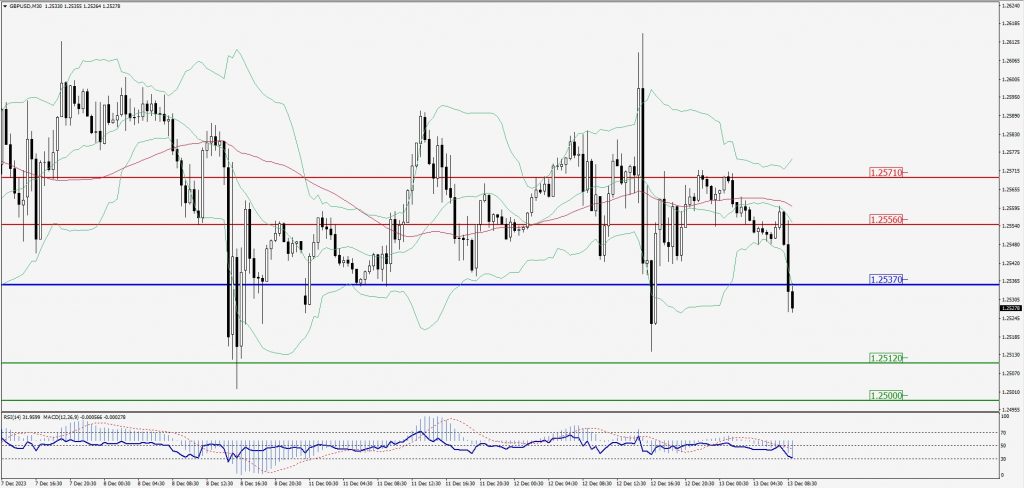
Green Lines Indicate Resistance Levels – Red Lines Indicate Support Levels
Light Blue is a Pivot Point – Black represents the price when the report was produced
USD/JPY Intraday: Major trend on the upside
Our pivot point is at 145.720
Preferable Price Action: Buy position above pivot with the target at 146.440 and 146.940 in extension.
Alternative Price Action: The downside breakout of the pivot would call for 145.110 and 144.640.
Comment: MACD is above 50 level and Pairs above its 20MA & 55MA.
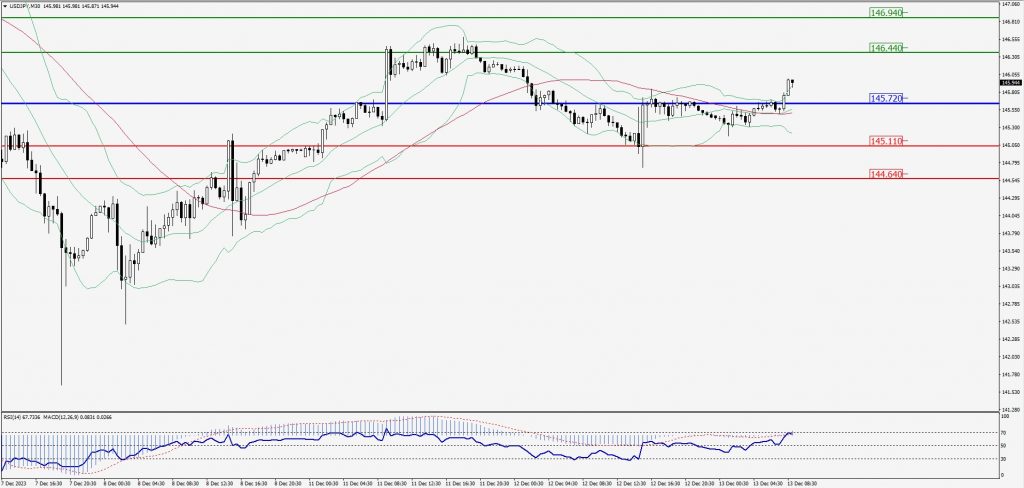
Green Lines Indicate Resistance Levels – Red Lines Indicate Support Levels
Light Blue is a Pivot Point – Black represents the price when the report was produced
AUD/USD Intraday: Trend on the downside
Our pivot point is at 0.65520
Preferable Price Action: Sell positions below pivot with targets at 0.65290 & 0.65150 in extension.
Alternative Price Action: Above pivot looks for a further upside with 0.65730 & 0.65900 as targets.
Comment: RSI is below 50 levels and Pairs below its 20MA & 55MA.
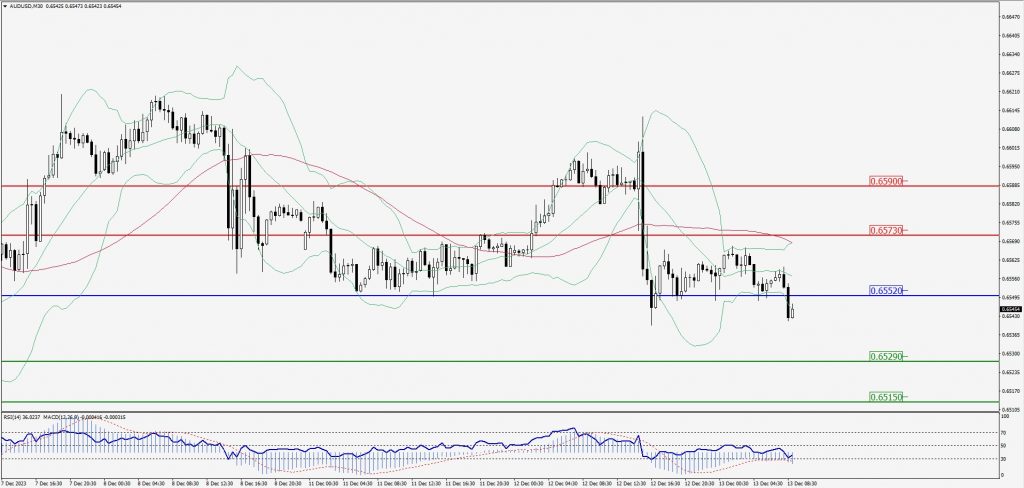
Green Lines Indicate Resistance Levels – Red Lines Indicate Support Levels
Light Blue is a Pivot Point – Black represents the price when the report was produced
CRUDEOIL Intraday: Trend on the downside
Our pivot point is at 68.67
Preferable Price Action: Below pivot sell oil with 67.84 & 67.40 as targets.
Alternative Price Action: Buy crude above pivot with targets at 69.41 and 69.92 in extension.
Comment: MACD is negative territory and Pairs below its 20MA & 55MA.
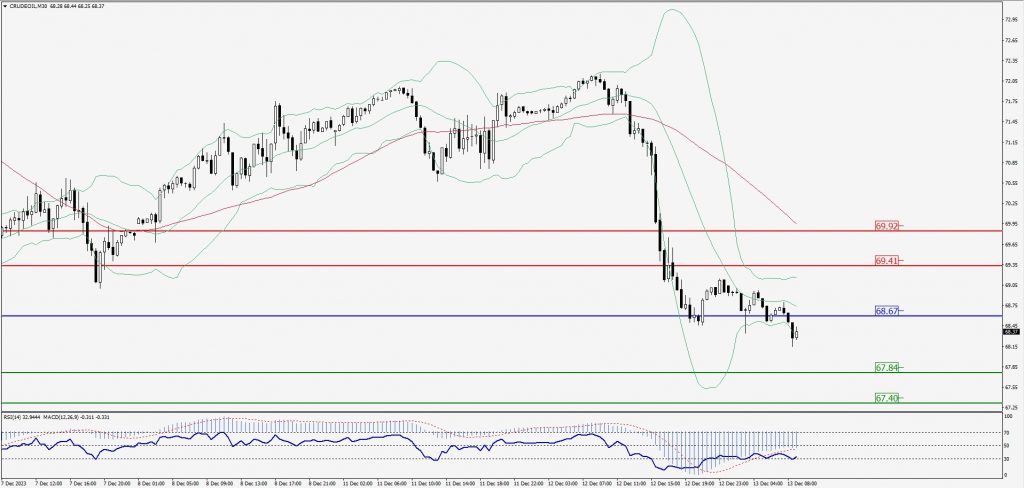
Green Lines Indicate Resistance Levels – Red Lines Indicate Support Levels
Light Blue is a Pivot Point – Black represents the price when the report was produced
XAU/USD Intraday: Resistance level at 1983.50
Our pivot point is 1983.50
Preferable Price Action: Further downside to 1969.70 and 1961.40.
Alternative Price Action: If the price gives an upside breakout of a pivot, then the price extends to 1995.50 and 2005.20.
Comment: MACD is below 50 level and Pairs below its 20MA & 55MA.
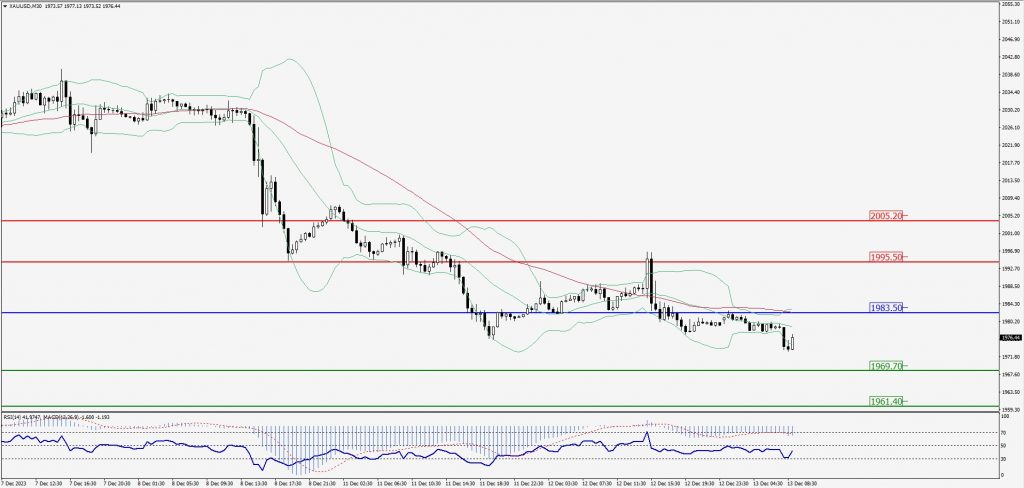
Green Lines Indicate Resistance Levels – Red Lines Indicate Support Levels
Light Blue is a Pivot Point – Black represents the price when the report was produced
Dow Jones Intraday: Trend on the upside
Our pivot point is 36,590.00
Preferable Price Action: Take buy positions above the pivot with targets at 36,687.00 & 36,754.00.
Alternative Price Action: Below 36,590.00 looks for further downside to 36,503.00 & 36,443.00.
Comment: RSI is above 50 levels and Pairs above 55MA.
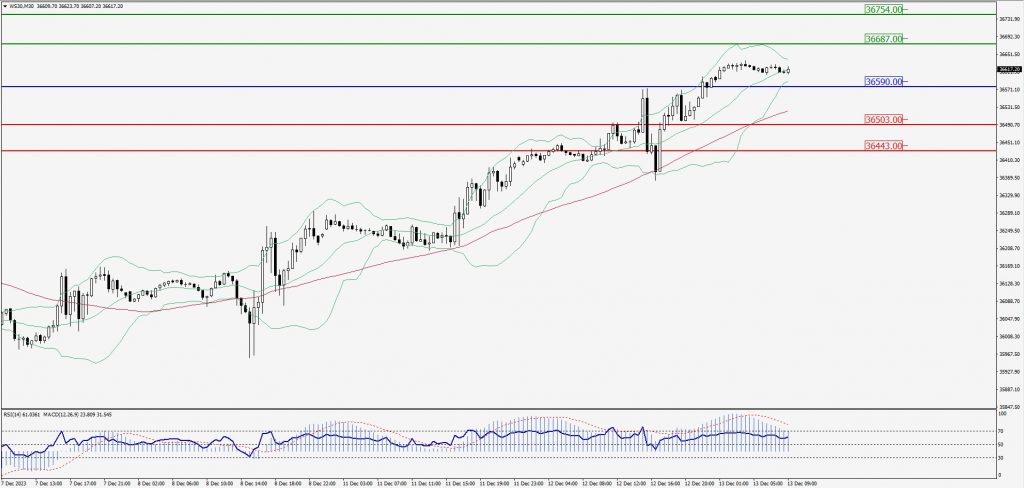
Green Lines Indicate Resistance Levels – Red Lines Indicate Support Levels
Light Blue is a Pivot Point – Black represents the price when the report was produced