Market Wrap: Stocks, Bonds, Commodities
The Nasdaq Composite closed higher Wednesday as investors fled to tech stocks after a tamer-than-expected inflation report.
The Dow Jones Industrial Average fell 30.48 points to 33,531.33, the S&P 500 gain 0.45% to 4,137.64 and the Nasdaq Composite add 126.89 points to 12,306.44.
MSCI’s index of Asia-Pacific stocks outside Japan is decline 0.29% to 628.82 levels. The Australian index was lower by 0.05% to 7,251.90. Japanese Nikkei Index advance 0.02% today.
European stocks were positive on Thursday, with the Stoxx Europe 50 Index rose 0.60% to 4,332.75, Germany’s DAX advance 0.18% to 15,922.65, and France’s CAC ascend 0.82% to 7,421.34, and U.K.’s FTSE 100 add 0.32% to 7,766.31.
Benchmark 10-year U.S. Treasury fell as demand for safe assets ascend again, today 10-year bond yields negative 0.04% to 3.4340.
Oil prices fell on Wednesday, ending a three-day rally as an unexpected rise in U.S. oil inventories sparked demand concerns and investors awaited inflation data for a steer on U.S. interest rates.
Spot Brent crude oil ascend 0.86% to $77.07 per barrel. US West Texas Intermediate crude is up 0.84% to $73.19 a barrel.
The yellow metal gold is decline 0.43% to 2,028.30 dollars per ounce.
Market Wrap: Forex
The U.S. dollar edged higher in early European trade Thursday, recovering after overnight losses, while sterling remained near recent highs ahead of the Bank of England’s latest policy-setting meeting.
Today, the U.S. dollar index measures the Greenback against a trade-weighted basket of six major currencies, which surged 0.42% to 101.690.
The Euro US Dollar (EUR/USD) is a widely traded pair that is down 0.47% today. This left the pair trading around $1.09280.
The Japanese yen was negative against the U.S. dollar on Thursday. Today USD/JPY is surged 0.28% to the 134.710 level.
Another commodity-related currency negative against the U.S dollar, AUD/USD fell 0.69% to 0.67320, and NZD/USD slipped 0.47% to 0.63360 level.
EUR/USD Intraday: Major trend on the downside
Our pivot point is at 1.09500
Preferable Price Action: Take sell positions below pivot level with targets at 1.09050 & 1.08770 in extension.
Alternative Price Action: Above pivot looks for a further upside to 1.09890 & 1.10200.
Comment: RSI is below 50 levels and Pairs below its 20MA & 55MA.
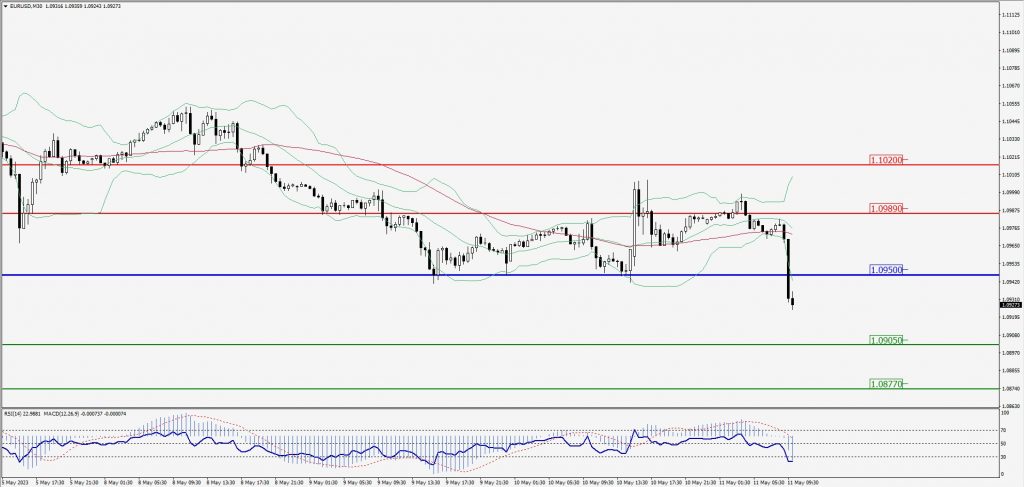
Green Lines Indicate Resistance Levels – Red Lines Indicate Support Levels
Light Blue is a Pivot Point – Black represents the price when the report was produced
GBP/USD Intraday: Resistance level at 1.25900
Our pivot point is at 1.25900
Preferable Price Action: Sell positions below pivot with targets at 1.25570 & 1.25380 in extension.
Alternative Price Action: The price above pivot would call for further upside to 1.26230 & 1.26470.
Comment: RSI is below 50 levels and Pairs below its 20MA & 55MA.
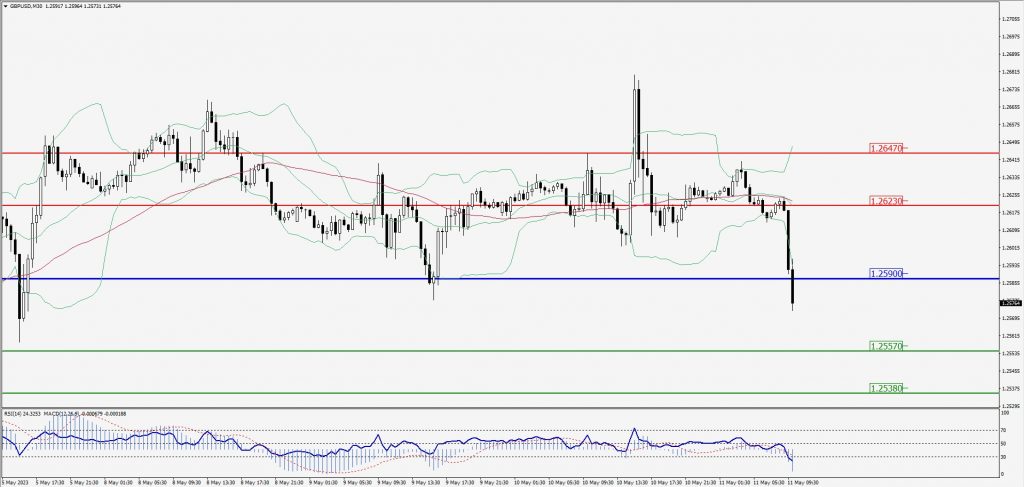
Green Lines Indicate Resistance Levels – Red Lines Indicate Support Levels
Light Blue is a Pivot Point – Black represents the price when the report was produced
USD/JPY Intraday: Trend on the upside
Our pivot point is at 134.350
Preferable Price Action: Buy position above pivot with the target at 134.710 and 134.960 in extension.
Alternative Price Action: The downside breakout of the pivot would call for 134.030 and 133.820.
Comment: MACD is above 50 level and Pairs above 20MA.
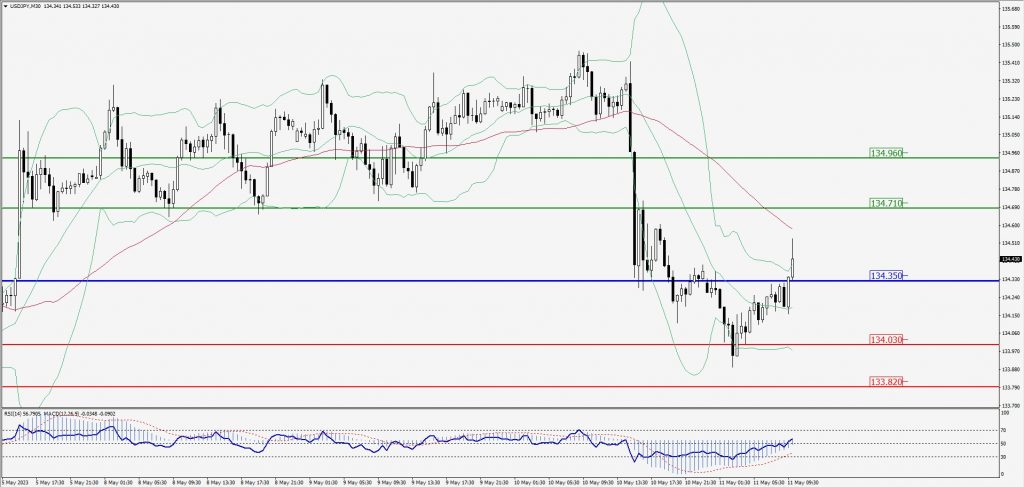
Green Lines Indicate Resistance Levels – Red Lines Indicate Support Levels
Light Blue is a Pivot Point – Black represents the price when the report was produced
AUD/USD Intraday: Trend on the downside
Our pivot point is at 0.67470
Preferable Price Action: Sell positions below pivot with targets at 0.67070 & 0.66830 in extension.
Alternative Price Action: Above pivot looks for a further upside with 0.67840 & 0.68100 as targets.
Comment: RSI is below 50 levels and Pairs below its 20MA & 55MA.
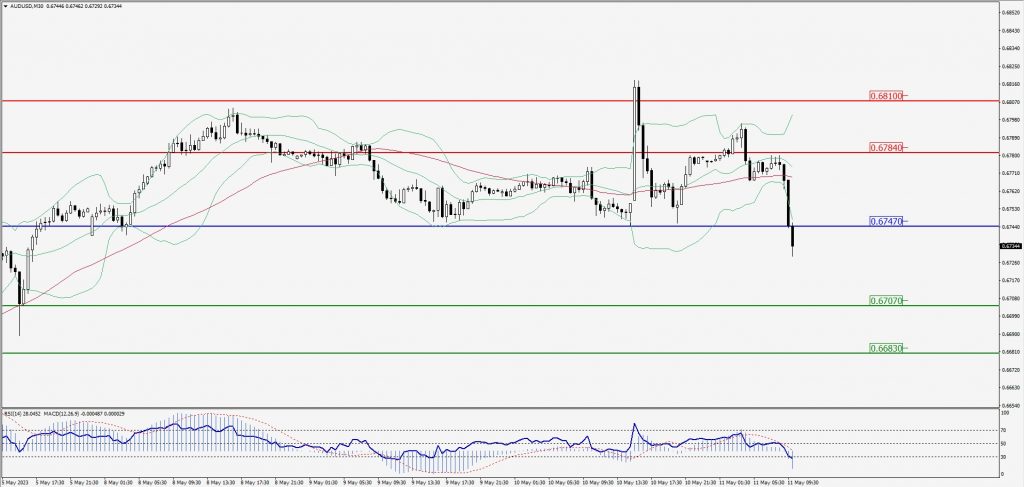
Green Lines Indicate Resistance Levels – Red Lines Indicate Support Levels
Light Blue is a Pivot Point – Black represents the price when the report was produced
CRUDEOIL Intraday: Resistance level at 73.22
Our pivot point is at 73.22
Preferable Price Action: Below pivot sell oil with 72.31 & 71.75 as targets.
Alternative Price Action: Buy crude above pivot with targets at 73.98 and 74.53 in extension.
Comment: MACD is negative territory and Pairs below 20MA.
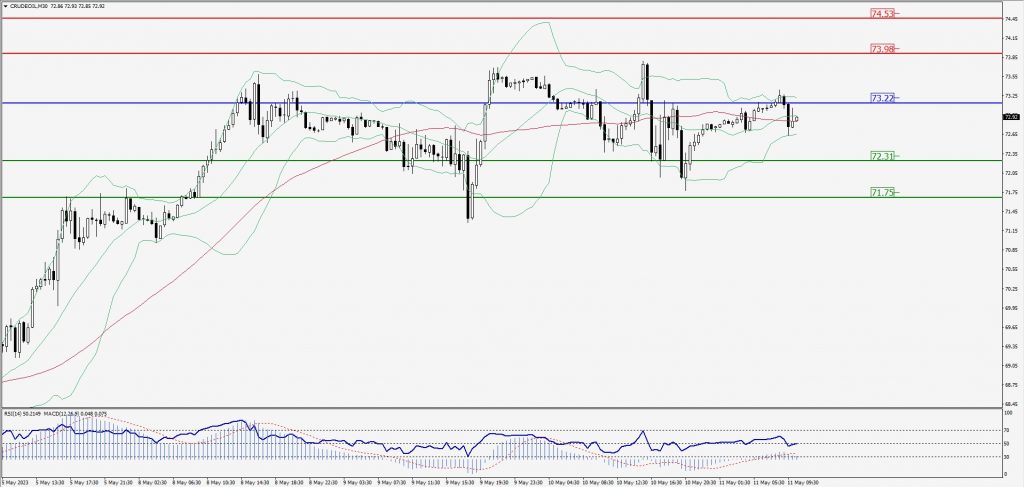
Green Lines Indicate Resistance Levels – Red Lines Indicate Support Levels
Light Blue is a Pivot Point – Black represents the price when the report was produced
XAU/USD Intraday: Trend on the downside
Our pivot point is 2028.90
Preferable Price Action: Further downside to 2016.50 and 2008.80
Alternative Price Action: If the price gives an upside breakout of a pivot, then the price extends to 2039.30 and 2045.80.
Comment: MACD is below 50 level and Pairs below its 20MA & 55MA.
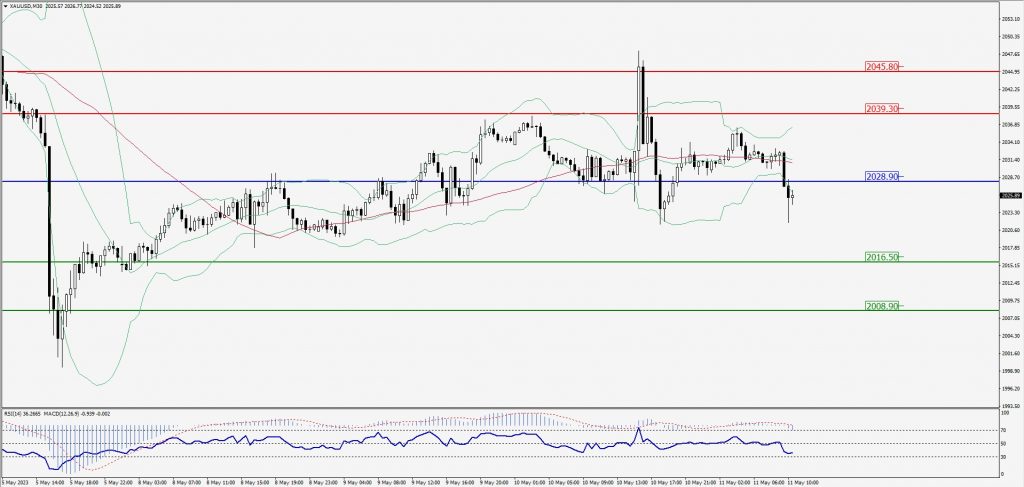
Green Lines Indicate Resistance Levels – Red Lines Indicate Support Levels
Light Blue is a Pivot Point – Black represents the price when the report was produced
Dow Jones Intraday: Trend on the upside
Our pivot point is 33,553.00
Preferable Price Action: Take buy positions above the pivot with targets at 33,666.00 & 33,755.00.
Alternative Price Action: Below 33,553.00 looks for further downside to 33,443.00 & 33,369.00.
Comment: RSI is above 50 levels and Pairs above its 20MA & 55MA.
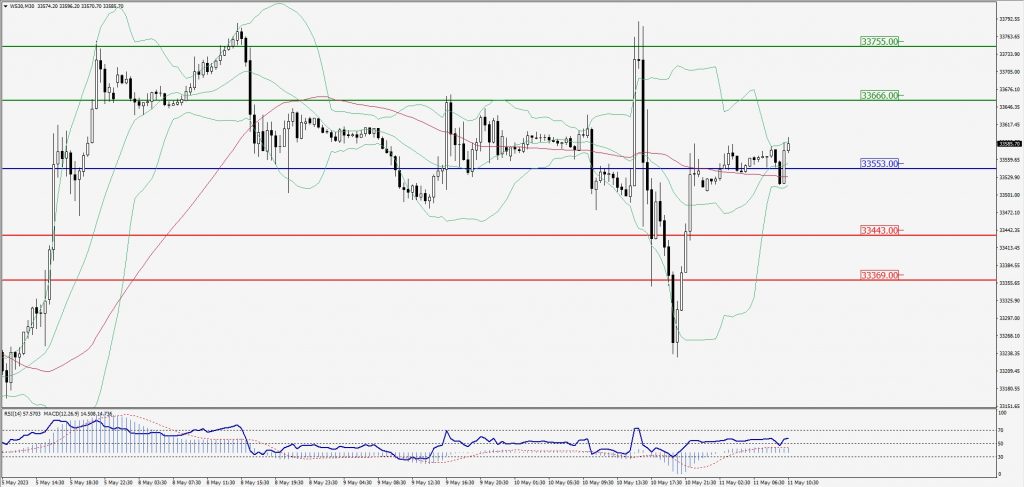
Green Lines Indicate Resistance Levels – Red Lines Indicate Support Levels
Light Blue is a Pivot Point – Black represents the price when the report was produced