Market Wrap: Stocks, Bonds, Commodities
Futures tied to the Dow Jones Industrial Average added 10 points, while S&P 500 and Nasdaq-100 futures were flat. Over the weekend, billionaire investor Warren Buffett commented on a slew of topics, including the latest banking crisis that rocked Wall Street, at Berkshire Hathaway’ s annual meeting in Omaha, Nebraska.
The Dow Jones Industrial Average rose 546.64 points to 33,674.38, the S&P 500 gain 1.85% to 4,136.25 and the Nasdaq Composite add 269.02 points to 12,235.41.
MSCI’s index of Asia-Pacific stocks outside Japan is advance 0.70% to 638.04 levels. The Australian index was higher by 0.78% to 7,276.50. Japanese Nikkei Index decline 0.68% today.
European stocks were positive on Monday, with the Stoxx Europe 50 Index rose 0.17% to 4,348.25, Germany’s DAX advance 0.08% to 15,972.37, and France’s CAC ascend 0.15% to 7,444.41, and U.K.’s FTSE 100 add 0.98% to 7,778.38.
Benchmark 10-year U.S. Treasury fell as demand for safe assets ascend again, today 10-year bond yields negative 0.32% to 3.4350.
Oil prices rose on Friday but fell for the third straight week after a sharp fall earlier this week ahead of benchmark interest rate rises and on concern that the US banking crisis will slow the economy and sap fuel demand.
Spot Brent crude oil ascend 1.90% to $76.73 per barrel. US West Texas Intermediate crude is up 2.10% to $72.87 a barrel.
The yellow metal gold is advance 0.28% to 2,030.55 dollars per ounce.
Market Wrap: Forex
The dollar began the week under pressure on Monday, with traders betting it might have peaked along with U.S. interest rates while keeping a wary eye on looming inflation and loans data..
Today, the U.S. dollar index measures the Greenback against a trade-weighted basket of six major currencies, which slipped 0.07% to 100.920.
The Euro US Dollar (EUR/USD) is a widely traded pair that is up 0.19% today. This left the pair trading around $1.10380.
The Japanese yen was negative against the U.S. dollar on Monday. Today USD/JPY is surged 0.13% to the 135.000 level.
Another commodity-related currency positive against the U.S dollar, AUD/USD rose 0.60% to 0.67880, and NZD/USD surged 0.62% to 0.63320 level.
EUR/USD Intraday: Trend on the upside
Our pivot point is at 1.10350
Preferable Price Action: Take buy positions above pivot level with targets at 1.10710 & 1.10970 in extension.
Alternative Price Action: Below pivot looks for a further downside to 1.10010 & 1.09780.
Comment: RSI is above 50 levels and Pairs above 55MA.
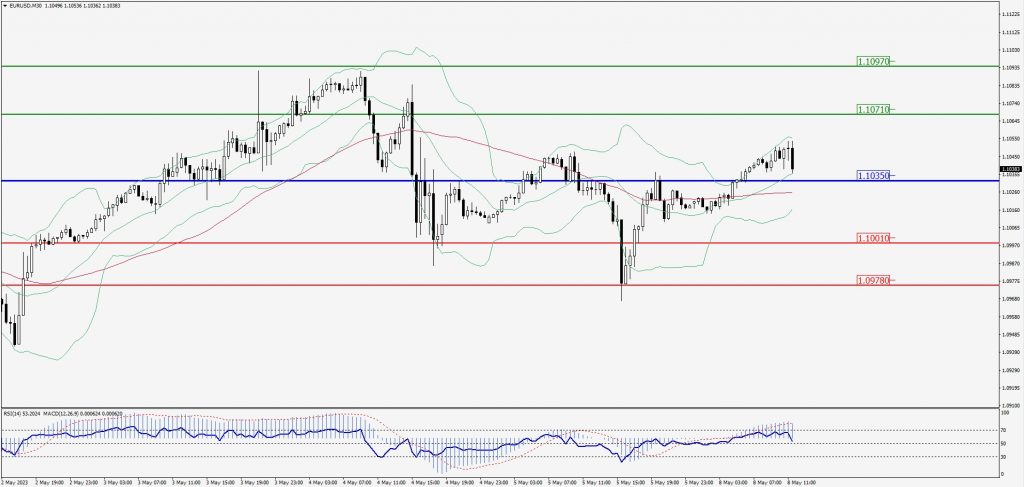
Green Lines Indicate Resistance Levels – Red Lines Indicate Support Levels
Light Blue is a Pivot Point – Black represents the price when the report was produced
GBP/USD Intraday: In a consolidation zone
Our pivot point is at 1.26580
Preferable Price Action: Sell positions below pivot with targets at 1.26120 & 1.25810 in extension.
Alternative Price Action: The price above pivot would call for further upside to 1.26970 & 1.27280.
Comment: RSI is at 50 levels and Pairs below 20MA.
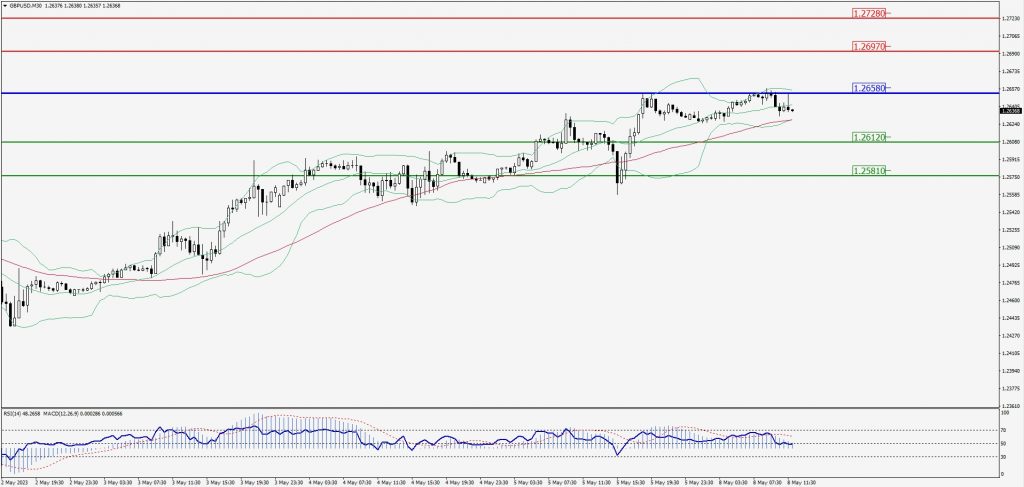
Green Lines Indicate Resistance Levels – Red Lines Indicate Support Levels
Light Blue is a Pivot Point – Black represents the price when the report was produced
USD/JPY Intraday: Support level at 134.720
Our pivot point is at 134.720
Preferable Price Action: Buy position above pivot with the target at 135.480 and 136.050 in extension.
Alternative Price Action: The downside breakout of the pivot would call for 133.940 and 133.270.
Comment: MACD is positive 50 level and Pairs above 55MA.
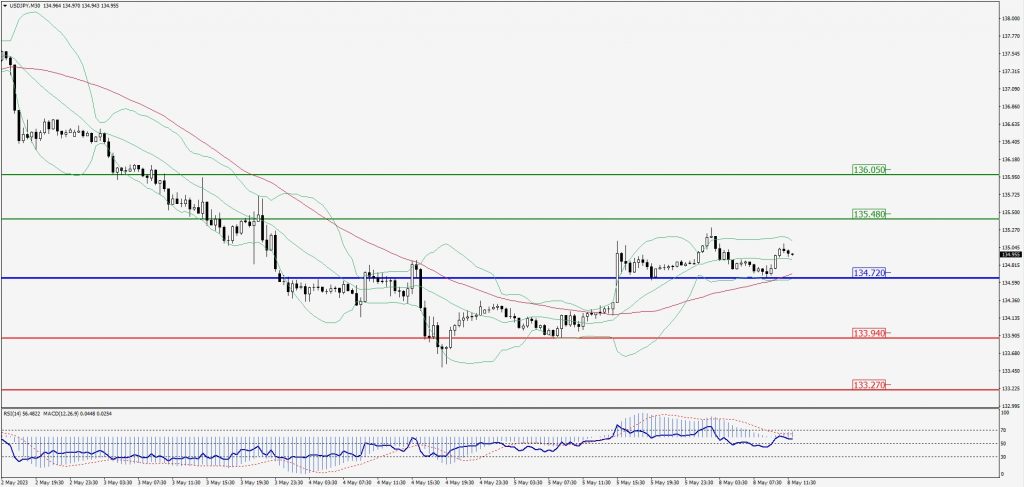
Green Lines Indicate Resistance Levels – Red Lines Indicate Support Levels
Light Blue is a Pivot Point – Black represents the price when the report was produced
AUD/USD Intraday: Major trend on the upside
Our pivot point is at 0.67770
Preferable Price Action: Buy positions above pivot with targets at 0.68120 & 0.68380 in extension.
Alternative Price Action: Below pivot looks for a further downside with 0.67460 & 0.67210 as targets.
Comment: RSI is above 50 levels and Pairs above its 20MA & 55MA.
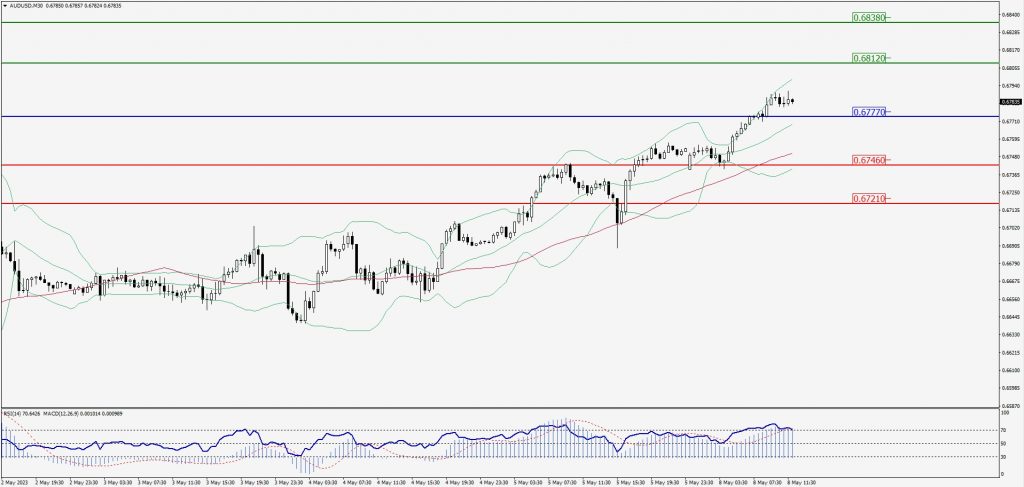
Green Lines Indicate Resistance Levels – Red Lines Indicate Support Levels
Light Blue is a Pivot Point – Black represents the price when the report was produced
CRUDEOIL Intraday: Trend on the upside
Our pivot point is at 71.66
Preferable Price Action: Above pivot buy oil with 73.82 & 75.30 as targets.
Alternative Price Action: Sell crude below pivot with targets at 69.75 and 68.45 in extension.
Comment: MACD is positive territory and Pairs above its 20MA & 55MA.
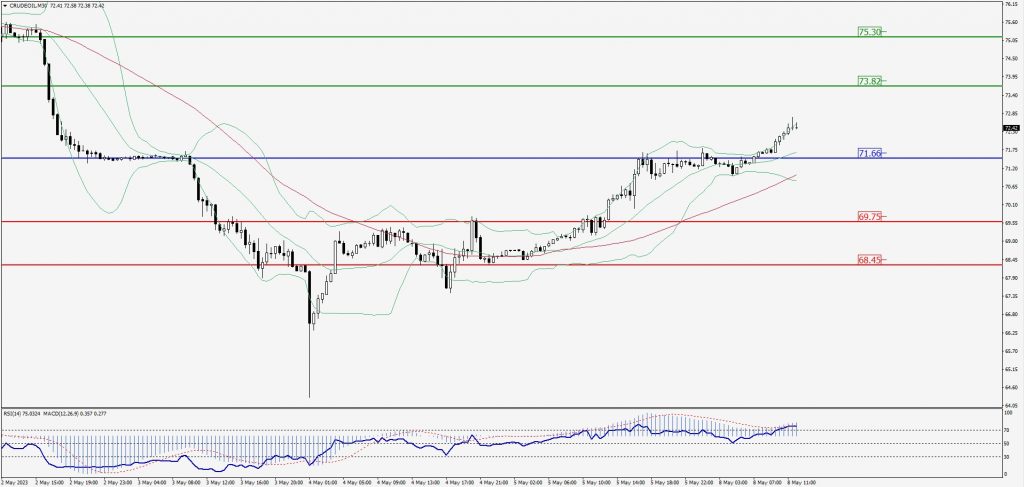
Green Lines Indicate Resistance Levels – Red Lines Indicate Support Levels
Light Blue is a Pivot Point – Black represents the price when the report was produced
XAU/USD Intraday: Trend on the upside
Our pivot point is 2019.60
Preferable Price Action: Further upside to 2040.60 and 2055.50
Alternative Price Action: If the price gives a downside breakout of a pivot, then the price extends to 1998.00 and 1983.30.
Comment: MACD is above 50 level and Pairs above 20MA.
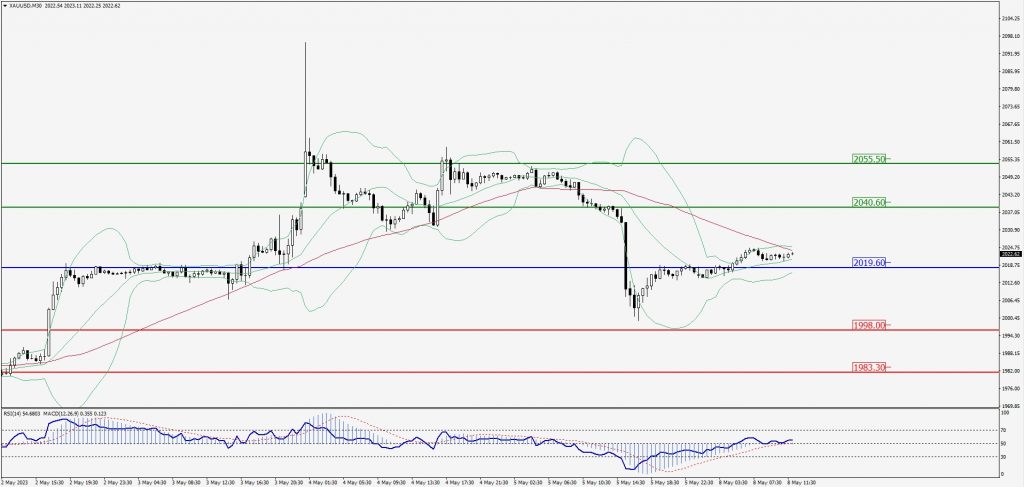
Green Lines Indicate Resistance Levels – Red Lines Indicate Support Levels
Light Blue is a Pivot Point – Black represents the price when the report was produced
Dow Jones Intraday: Trend on the upside
Our pivot point is 33,658.00
Preferable Price Action: Take buy positions above the pivot with targets at 33,846.00 & 33,986.00.
Alternative Price Action: Below 33,658.00 looks for further downside to 33,494.00 & 33,374.00.
Comment: RSI is above 50 levels and Pairs above its 20MA & 55MA.
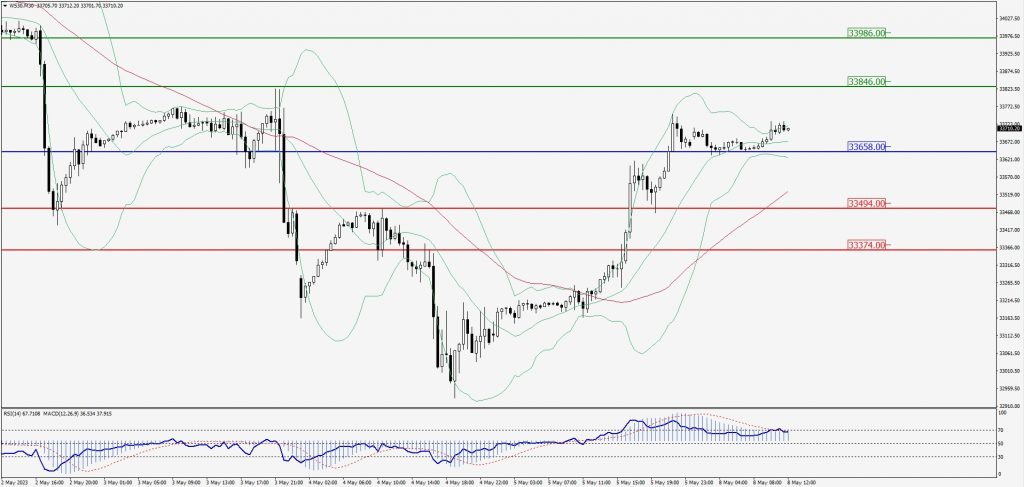
Green Lines Indicate Resistance Levels – Red Lines Indicate Support Levels
Light Blue is a Pivot Point – Black represents the price when the report was produced