Market Wrap: Stocks, Bonds, Commodities
The S&P 500 made little progress on Monday, closing slightly higher than its session low as U.S. Treasury yields pulled higher with investors braced for this week’s testimony from Federal Reserve Chair Jerome Powell and the February jobs report.
The Dow Jones Industrial Average rose 40.47 points to 33,431.44, the S&P 500 gain 0.07% to 4,048.42 and the Nasdaq Composite subtract 13.27 points to 11,675.74
MSCI’s index of Asia-Pacific stocks outside Japan is decline 0.24% to 642.81 levels. The Australian index was higher by 0.49% to 7,364.70. Japanese Nikkei Index rose 0.25% today.
European stocks were positive on Tuesday, with the Stoxx Europe 50 Index gain 0.05% to 4,315.85, Germany’s DAX rose 0.15% to 15,675.05, and France’s CAC advance 0.14% to 7,383.49, and U.K.’s FTSE 100 add 0.12% to 7,939.25.
Benchmark 10-year U.S. Treasury fell as demand for safe assets ascend again, today 10-year bond yields are negative 1.07% to 3.9400.
Oil prices were little changed on Tuesday, after rising for the past five sessions, as concerns about limited spare capacity in the market and uncertainty over Russian supplies offset mixed oil data from top crude importer China.
Spot Brent crude oil fell 0.21% to $85.95 per barrel. US West Texas Intermediate crude is down 0.22% to $79.28 a barrel.
The yellow metal gold is decline 0.16% to 1,851.60 dollars per ounce.
Market Wrap: Forex
The U.S. dollar slipped lower in early European trade Tuesday ahead of a testimony by Federal Reserve Chair Jerome Powell before U.S. Congress, while sterling gained after signs of a resilient housing market.
Today, the U.S. dollar index measures the Greenback against a trade-weighted basket of six major currencies, which slipped 0.01% to 104.290.
The Euro US Dollar (EUR/USD) is a widely traded pair that is down 0.10% today. This left the pair trading around $1.06670.
The Japanese yen was negative against the U.S. dollar on Tuesday. Today USD/JPY is decline 0.23% to the 135.590 level.
Another commodity-related currency mixed against the U.S dollar, AUD/USD lose 0.59% to 0.66860, and NZD/USD rose 0.29% to 0.62120 level.
EUR/USD Intraday: Support level at 1.06780
Our pivot point is at 1.06780
Preferable Price Action: Take long positions above pivot level with targets at 1.07060 & 1.07250 in extension.
Alternative Price Action: Below pivot looks for a further downside to 1.06510 & 1.06290.
Comment: RSI is at 50 levels and Pairs above 55MA.
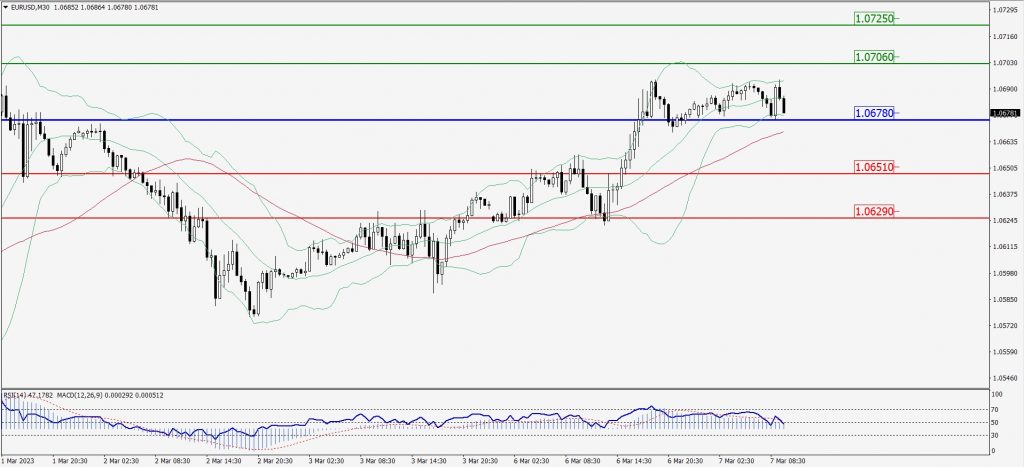
Green Lines Indicate Resistance Levels – Red Lines Indicate Support Levels
Light Blue is a Pivot Point – Black represents the price when the report was produced
GBP/USD Intraday: Trend on the upside
Our pivot point is at 1.20270
Preferable Price Action: Buy positions above pivot with targets at 1.20660 & 1.20950 in extension.
Alternative Price Action: The price below pivot would call for further downside to 1.19950 & 1.19700.
Comment: RSI is above 50 levels and Pairs above its 20MA & 55MA.
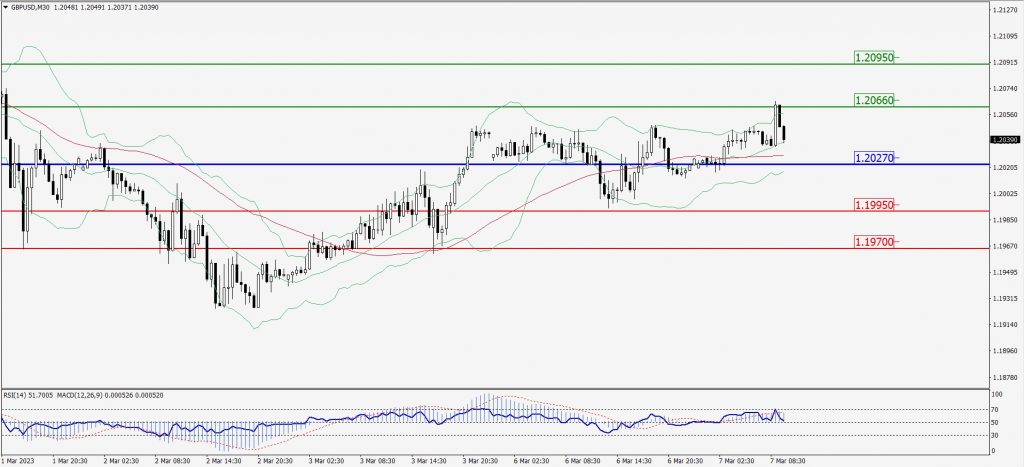
Green Lines Indicate Resistance Levels – Red Lines Indicate Support Levels
Light Blue is a Pivot Point – Black represents the price when the report was produced
USD/JPY Intraday: Trend on the downside
Our pivot point is at 135.860
Preferable Price Action: Sell position below pivot with the target at 135.560 and 135.340 in extension.
Alternative Price Action: The upside breakout of the pivot would call for 136.110 and 136.300.
Comment: MACD is below 50 level and Pairs below its 20MA & 55MA.
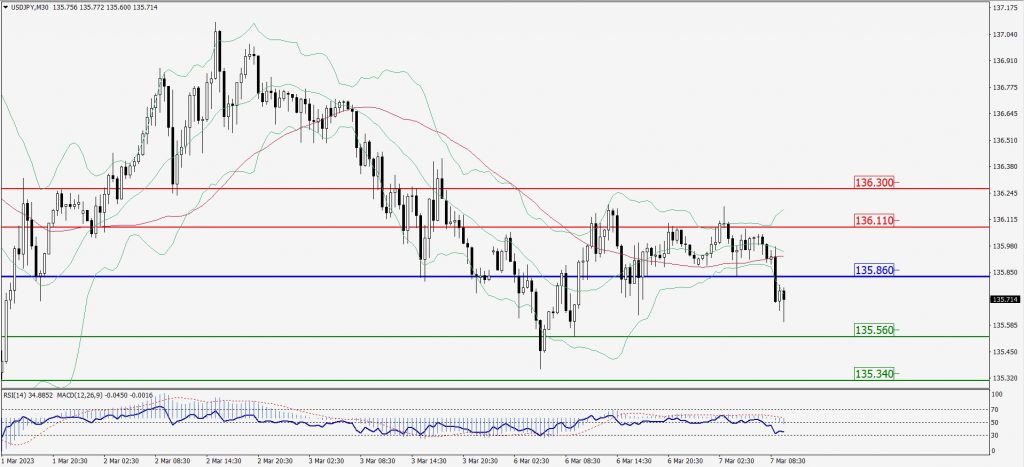
Green Lines Indicate Resistance Levels – Red Lines Indicate Support Levels
Light Blue is a Pivot Point – Black represents the price when the report was produced
AUD/USD Intraday: Major trend on the downside
Our pivot point is at 0.67050
Preferable Price Action: Sell positions below pivot with targets at 0.66740 & 0.66530 in extension.
Alternative Price Action: Above pivot looks for a further upside with 0.67320 & 0.67530 as targets.
Comment: RSI is below 50 levels and pairs below its 20MA & 55MA.
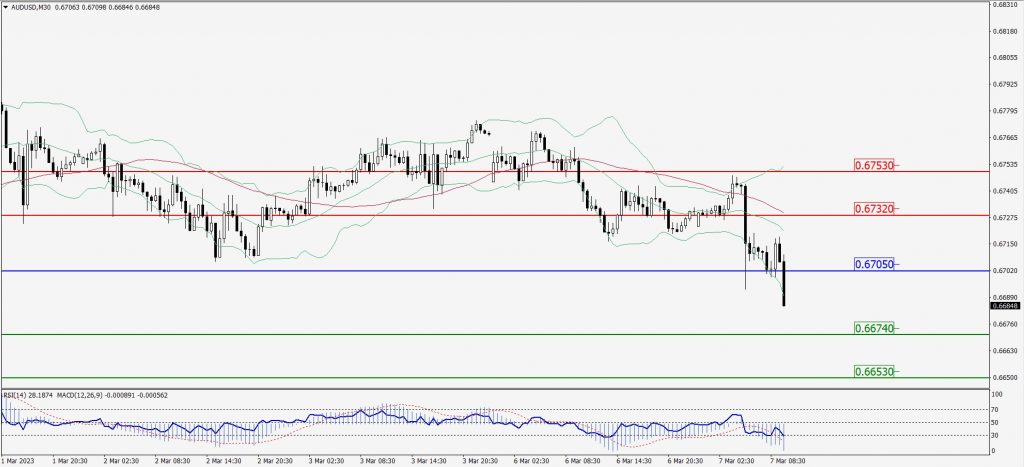
Green Lines Indicate Resistance Levels – Red Lines Indicate Support Levels
Light Blue is a Pivot Point – Black represents the price when the report was produced
CRUDEOIL Intraday: Trend on the upside
Our pivot point is at 80.22
Preferable Price Action: Above pivot buy oil with 81.22 & 82.05 as targets.
Alternative Price Action: Sell crude below pivot with targets at 79.35 and 78.58 in extension.
Comment: MACD is positive territory and Pairs above 55MA.
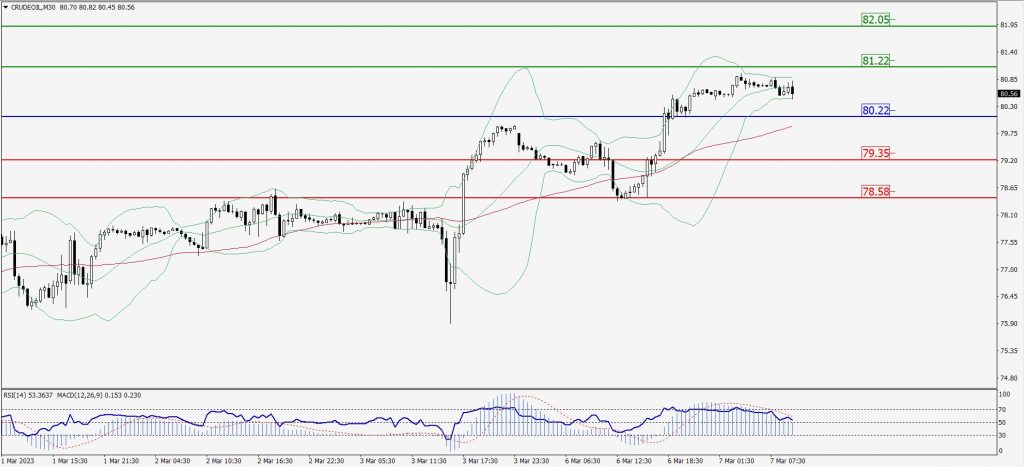
Green Lines Indicate Resistance Levels – Red Lines Indicate Support Levels
Light Blue is a Pivot Point – Black represents the price when the report was produced
XAU/USD Intraday: Resistance level at 1849.10
Our pivot point is 1849.10
Preferable Price Action: Further downside to 1843.00 and 1838.80
Alternative Price Action: If the price gives an upside breakout of a pivot, then the price extends to 1854.90 and 1859.10.
Comment: MACD is below 50 level and Pairs below 55MA.
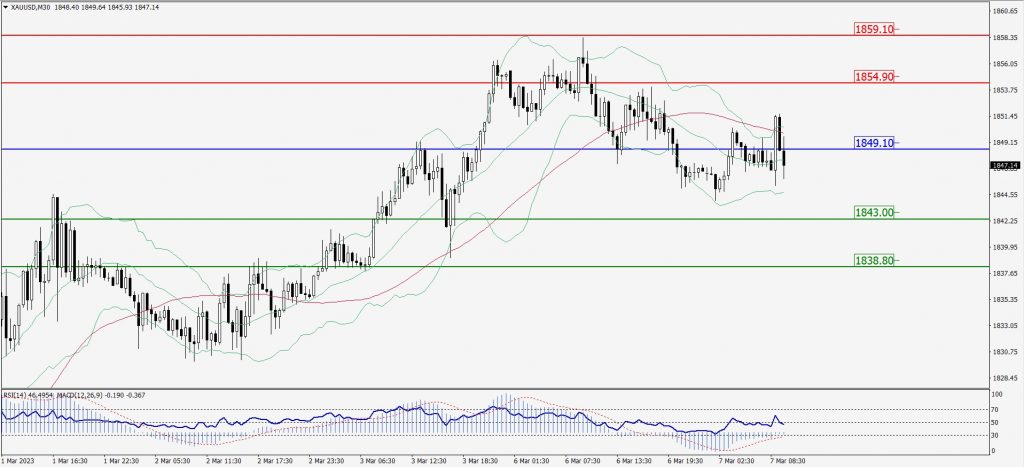
Green Lines Indicate Resistance Levels – Red Lines Indicate Support Levels
Light Blue is a Pivot Point – Black represents the price when the report was produced
Dow Jones Intraday: Trend on the upside
Our pivot point is 33,418.00
Preferable Price Action: Take buy positions above the pivot with targets at 33,593.00 & 33,717.00.
Alternative Price Action: Below 33,418.00 looks for further downside to 33,259.00 & 33,135.00.
Comment: RSI is above 50 levels and Pairs above 50MA.
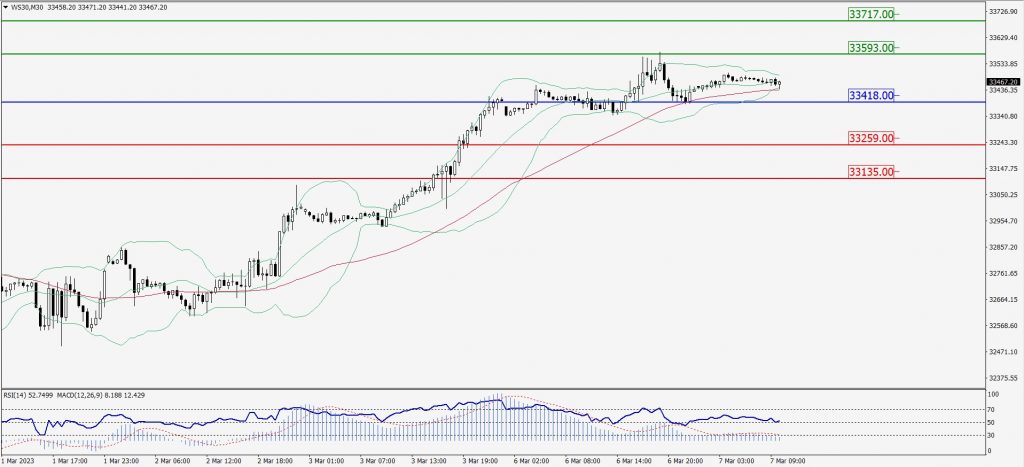
Green Lines Indicate Resistance Levels – Red Lines Indicate Support Levels
Light Blue is a Pivot Point – Black represents the price when the report was produced