Market Wrap: Stocks, Bonds, Commodities
US stocks ended a choppy session slightly higher on Monday, helped by gains in Amazon.com and other mega-cap growth shares, while persistent worries over inflation and interest rates kept a lid on the market.
The Dow Jones Industrial Average rose 16.08 points to 32,915.78, the S&P 500 gain 12.89 points to 4,121.43 and the Nasdaq Composite add 48.64 points to 12,061.37.
MSCI’s index of Asia-Pacific stocks outside Japan is drop 0.86% to 680.36 levels. Australian index lower 1.53% to 7,095.70. Japanese Nikkei Index ascend 0.10% to 27,943.95.
European stocks were negative on Tuesday, with the Stoxx Europe 50 Index fell 0.52% to 3,818.45, Germany’s DAX decline 0.61% to 14,565.00, and France’s CAC lose 0.41% to 6,521.61, and U.K.’s FTSE 100 fell 0.11% to 7,599.76.
Benchmark 10-year U.S. Treasury fell as demand for safe assets ascend again, today 10-year bond yields a negative 0.55% to 3.021.
Oil prices settled slightly lower after choppy trade on Monday, buoyed by Saudi Arabia raising its July crude prices but amid doubts that a higher output target for OPEC+ oil producers would ease tight supply.
Spot Brent crude oil add 0.45% to $120.09 per barrel. US West Texas Intermediate crude is up 0.47% to $119.08 a barrel.
The yellow metal gold is advance 0.05% to 1,844.70 dollars per ounce.
Market Wrap: Forex
The dollar gained against a basket of major currencies on Monday as risk appetite waned from earlier levels, with U.S. stocks well off their earlier highs to increase the appeal of the safe-haven ahead of a key reading on inflation later in the week.
Today, the U.S. dollar index measures the Greenback against a trade-weighted basket of six major currencies, which is a rose 0.19% to 102.640.
The Euro US Dollar (EUR/USD) is a widely traded pair that is down 0.07% today. This left the pair trading around $1.06870.
The Japanese yen was positive against the U.S. dollar on Tuesday as the stock up. Today USD/JPY is rose 0.70% to 132.800 level.
Another commodity-related currency negative against the U.S dollar, AUD/USD lose 0.11% to 0.71830, and NZD/USD down 0.68 to 0.64450 level.
EUR/USD Intraday: Trend on the downside
Our pivot point is at 1.06900
Preferable Price Action: Take sell positions below pivot level with targets at 1.06330 & 1.05910 in extension.
Alternative Price Action: Above pivot looks for a further upside to 1.07400 & 1.07860.
Comment: RSI below 50 levels and Pair below its 20MA & 55MA.
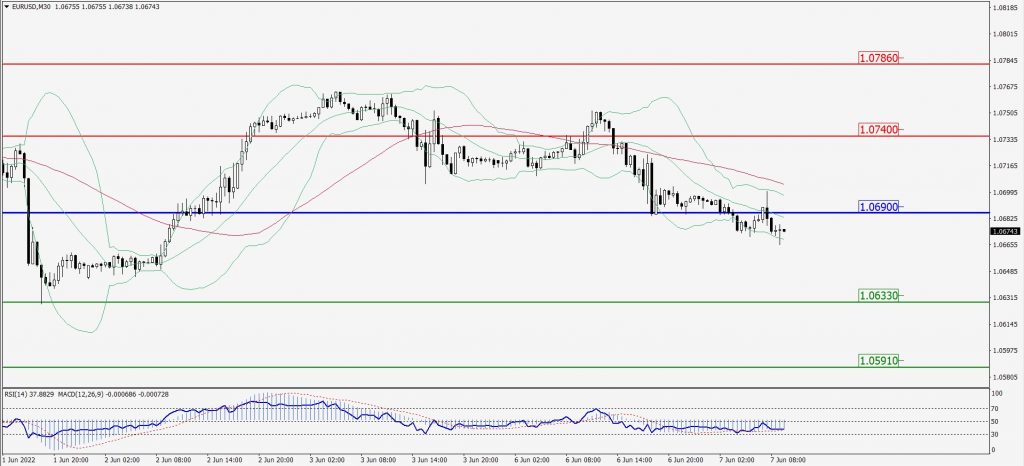
Green Lines Indicate Resistance Levels – Red Lines Indicate Support Levels
Light Blue is a Pivot Point – Black represents the price when the report was produced
GBP/USD Intraday: Major trend on the downside
Our pivot point is at 1.24730
Preferable Price Action: Sell positions below pivot with targets at 1.23820 & 1.23100 in extension.
Alternative Price Action: The price above pivot would call for further upside to 1.25420 & 1.26070.
Comment: RSI below 50 levels pair below its 20MA & 55MA.
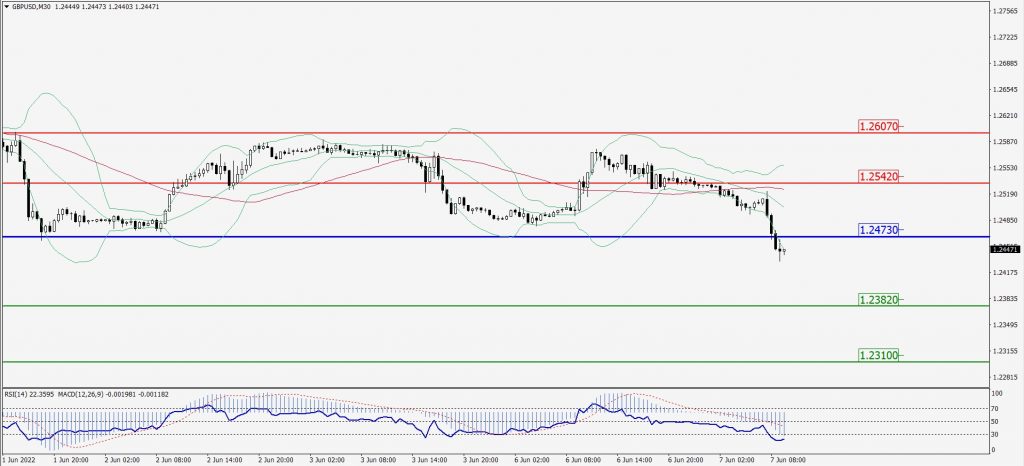
Green Lines Indicate Resistance Levels – Red Lines Indicate Support Levels
Light Blue is a Pivot Point – Black represents the price when the report was produced
USD/JPY Intraday: Major trend on the upside
Our pivot point is at 132.560
Preferable Price Action: Buy position above pivot with the target at 134.420 and 136.000 in extension.
Alternative Price Action: The downside breakout of the pivot would call for 130.660 and 129.020.
Comment: MACD is positive territory and Pair above its 20MA & 55MA.
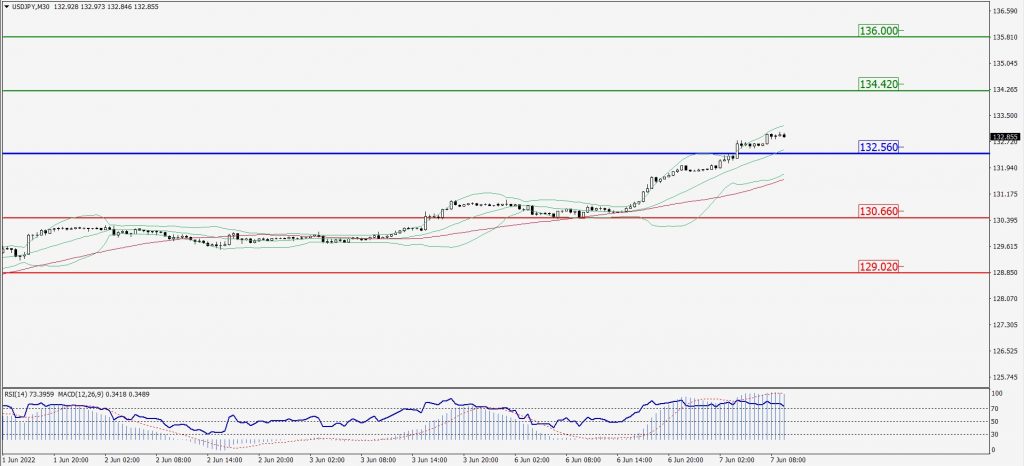
Green Lines Indicate Resistance Levels – Red Lines Indicate Support Levels
Light Blue is a Pivot Point – Black represents the price when the report was produced
AUD/USD Intraday: In a consolidation zone
Our pivot point is at 0.71830
Preferable Price Action: Buy Positions above pivot with targets at 0.72440 & 0.72950 in extension.
Alternative Price Action: Below pivot looks for a further downside with 0.71200 & 0.70770 as targets.
Comment: RSI above 50 levels and Pair above 20MA.
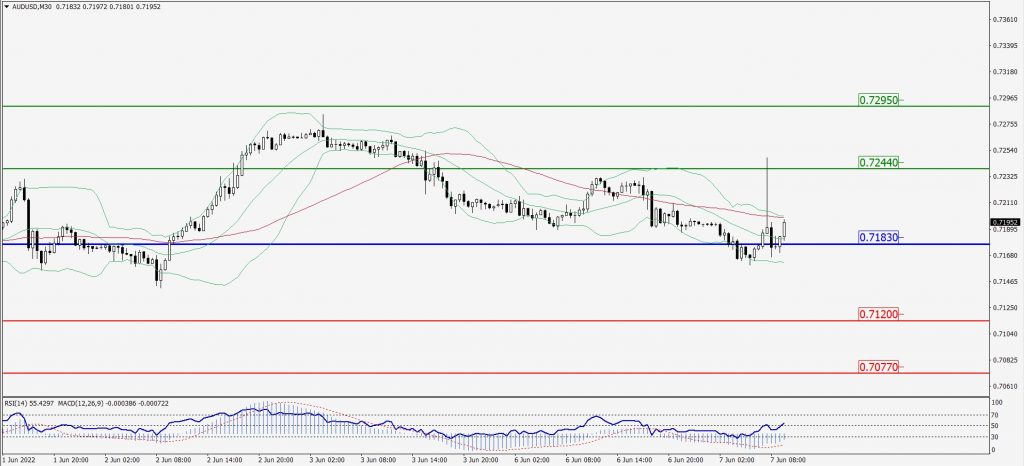
Green Lines Indicate Resistance Levels – Red Lines Indicate Support Levels
Light Blue is a Pivot Point – Black represents the price when the report was produced
CRUDEOIL Intraday: In a consolidation zone
Our pivot point is at 117.20
Preferable Price Action: above pivots buy oil with 120.60 & 123.00 as targets.
Alternative Price Action: Sell crude below pivot with targets at 114.50 and 112.30 in extension.
Comment: MACD is in the positive territory and Pair above 55MA.
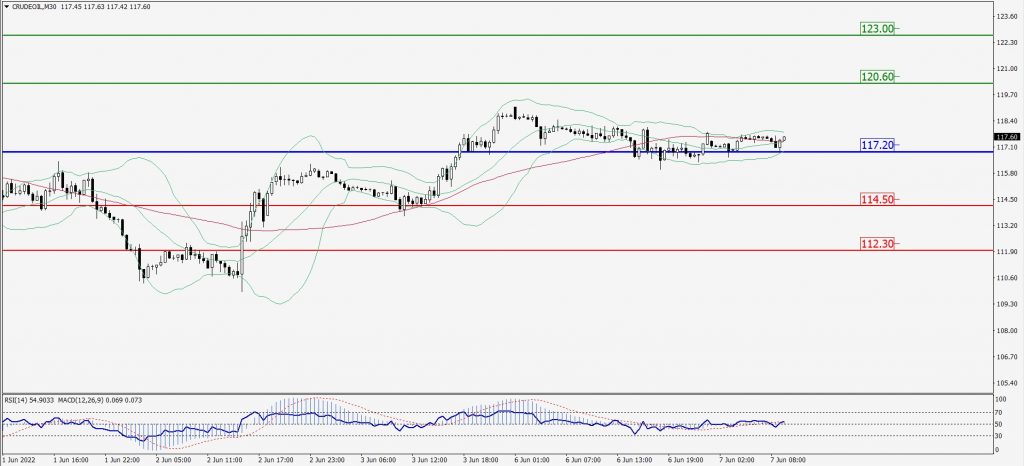
Green Lines Indicate Resistance Levels – Red Lines Indicate Support Levels
Light Blue is a Pivot Point – Black represents the price when the report was produced
XAU/USD Intraday: Trend on the downside
Our pivot point is 1847.10
Preferable Price Action: Further downside to 1830.60 and 1817.20
Alternative Price Action: If the price gives an upside breakout of a pivot, then the price extends to 1860.90 and 1874.00.
Comment: MACD is negative territory and pair below 55MA.
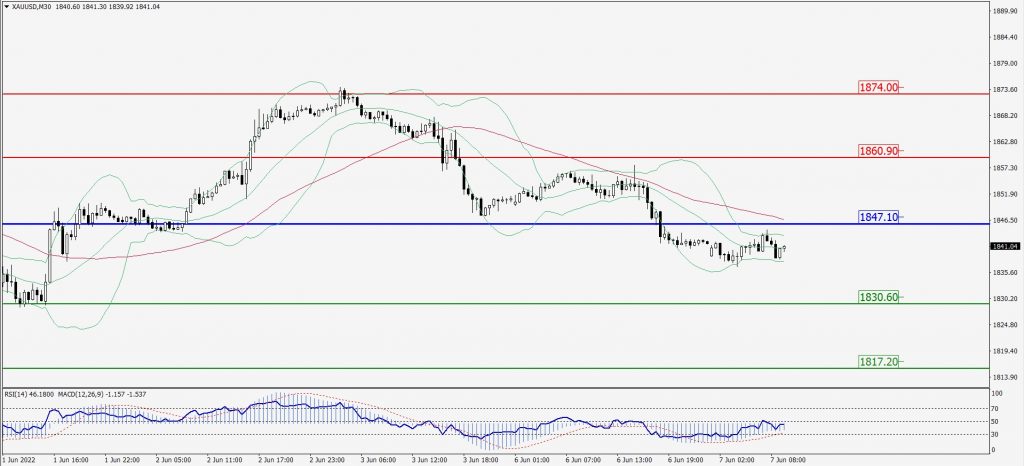
Green Lines Indicate Resistance Levels – Red Lines Indicate Support Levels
Light Blue is a Pivot Point – Black represents the price when the report was produced
Dow Jones Intraday: Trend on the downside
Our pivot point is 32,877.00
Preferable Price Action: Take sell positions below pivot with targets at 32,443.00 & 32,139.00.
Alternative Price Action: Above 32,877.00 looks for further upside to 33,222.00 & 33,520.00.
Comment: RSI below 50 levels and Pair below its 20MA & 55MA.
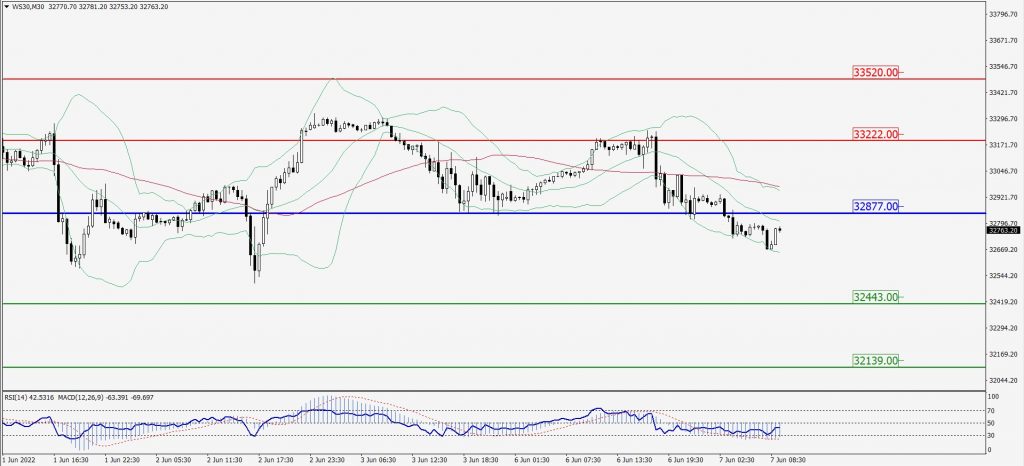
Green Lines Indicate Resistance Levels – Red Lines Indicate Support Levels
Light Blue is a Pivot Point – Black represents the price when the report was produced