Market Wrap: Stocks, Bonds, Commodities
Wall Street’s main indexes ended sharply lower on Thursday in a broad sell-off after data showing a strong labor market boosted bond yields and fanned fears the Federal Reserve will be aggressive in raising U.S. interest rates.
The Dow Jones Industrial Average fell 366.38 points to 32,922.26, the S&P 500 lose 0.79% to 4,411.59 and the Nasdaq Composite subtract 112.62 points to 13,679.04.
MSCI’s index of Asia-Pacific stocks outside Japan is decline 0.90% to 621.66 levels. The Australian index was lower by 1.69% to 7,042.30. Japanese Nikkei Index decline 1.17% today.
European stocks were negative on Friday, with the Stoxx Europe 50 Index fell 0.17% to 4,216.05, Germany’s DAX decline 0.07% to 15,516.55, and France’s CAC drop 0.02% to 7,083.02 and U.K.’s FTSE 100 subtract 0.49% to 7,245.04.
Benchmark 10-year U.S. Treasury fell as demand for safe assets ascend again, today 10-year bond yields negative 0.02% to 4.0420.
Oil prices were largely unchanged on Friday, but set to post weekly gains, as fears of higher U.S. interest rates that could dampen energy demand were offset by signs of tighter supply after a larger-than-expected fall in U.S. oil stocks.
Spot Brent crude oil drop 0.09% to $76.47 per barrel. US West Texas Intermediate crude is down 0.03% to $71.78 a barrel.
The yellow metal gold is advance 0.31% to 1,921.25 dollars per ounce.
Market Wrap: Forex
The dollar held tight ranges on Friday as investors awaited a key U.S. jobs report and weighed the prospect of higher-for-longer Federal Reserve interest rates against the economic growth outlook.
Today, the U.S. dollar index measures the Greenback against a trade-weighted basket of six major currencies, which slipped 0.10% to 102.750.
The Euro US Dollar (EUR/USD) is a widely traded pair that is down 0.07% today. This left the pair trading around $1.08790.
The Japanese yen was negative against the U.S. dollar on Friday. Today USD/JPY is slipped 0.73% to the 143.020 level.
Another commodity-related currency positive against the U.S dollar, AUD/USD rose 0.23% to 0.66400, and NZD/USD surged 0.42% to 0.61810 level.
EUR/USD Intraday: Resistance level at 1.08940
Our pivot point is at 1.08940
Preferable Price Action: Take sell positions below pivot level with targets at 1.08710 & 1.08570 in extension.
Alternative Price Action: Above pivot looks for a further upside to 1.09140 & 1.09290.
Comment: RSI is at 50 levels and Pairs below 20MA.
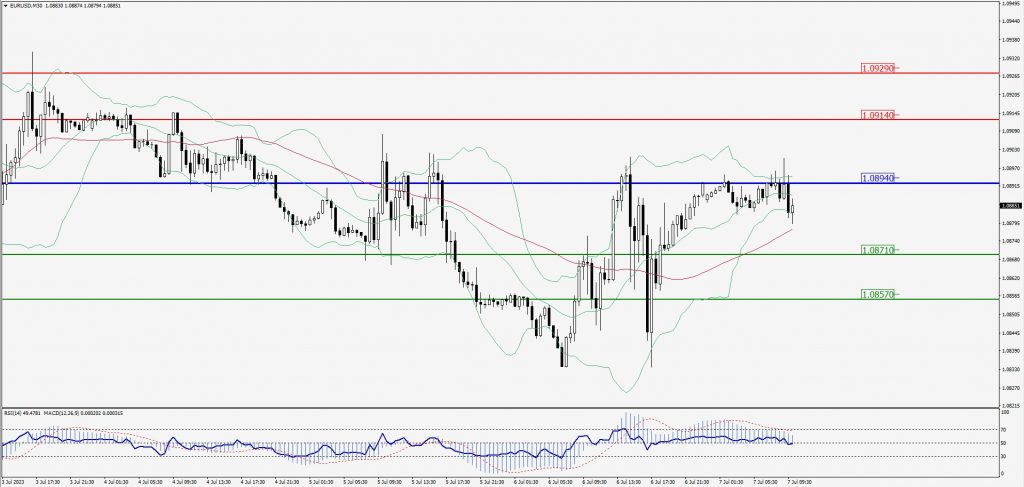
Green Lines Indicate Resistance Levels – Red Lines Indicate Support Levels
Light Blue is a Pivot Point – Black represents the price when the report was produced
GBP/USD Intraday: In a consolidation zone
Our pivot point is at 1.27460
Preferable Price Action: Sell positions below pivot with targets at 1.27240 & 1.27110 in extension.
Alternative Price Action: The price above pivot would call for further upside to 1.27650 & 1.27800.
Comment: RSI is at 50 levels and Pairs below 20MA.
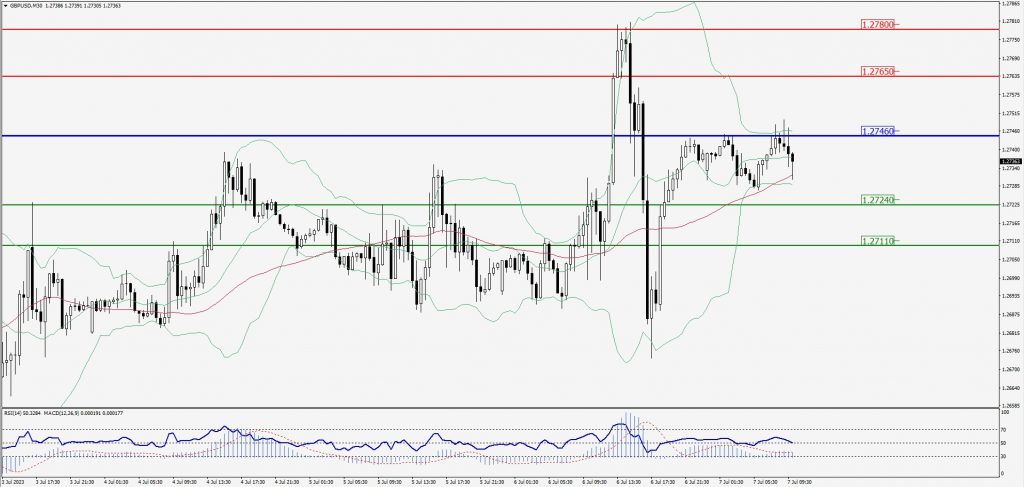
Green Lines Indicate Resistance Levels – Red Lines Indicate Support Levels
Light Blue is a Pivot Point – Black represents the price when the report was produced
USD/JPY Intraday: Major trend on the downside
Our pivot point is at 143.700
Preferable Price Action: Sell position below pivot with the target at 143.330 and 143.080 in extension.
Alternative Price Action: The upside breakout of the pivot would call for 144.020 and 144.280.
Comment: MACD is below 50 level and Pairs below its 20MA & 55MA.
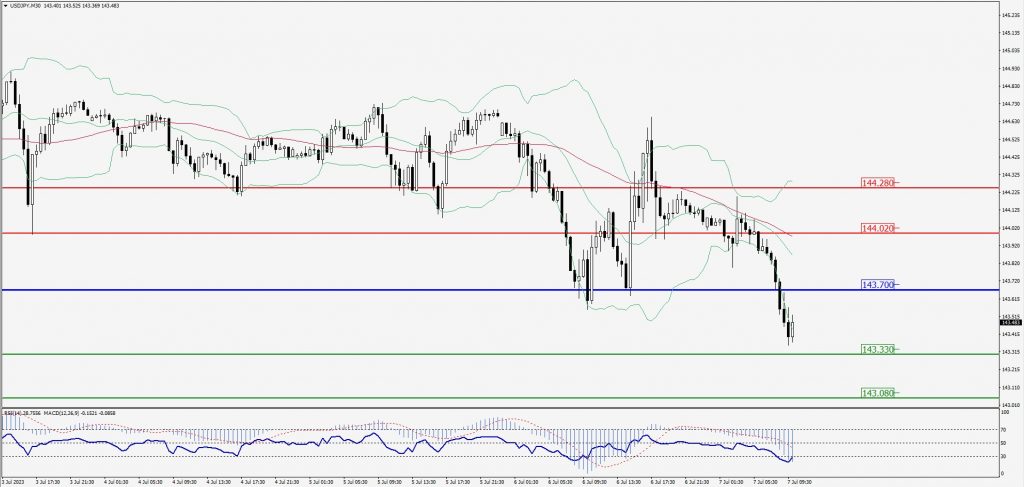
Green Lines Indicate Resistance Levels – Red Lines Indicate Support Levels
Light Blue is a Pivot Point – Black represents the price when the report was produced
AUD/USD Intraday: In a consolidation zone
Our pivot point is at 0.66410
Preferable Price Action: Sell positions below pivot with targets at 0.66140 & 0.65970 in extension.
Alternative Price Action: Above pivot looks for a further upside with 0.66640 & 0.66820 as targets.
Comment: RSI is at 50 levels and Pairs below 55MA.
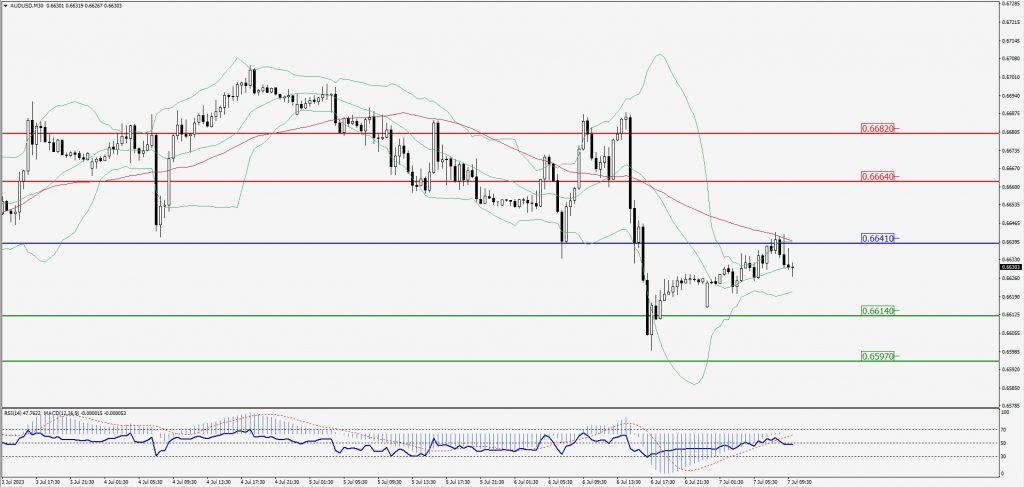
Green Lines Indicate Resistance Levels – Red Lines Indicate Support Levels
Light Blue is a Pivot Point – Black represents the price when the report was produced
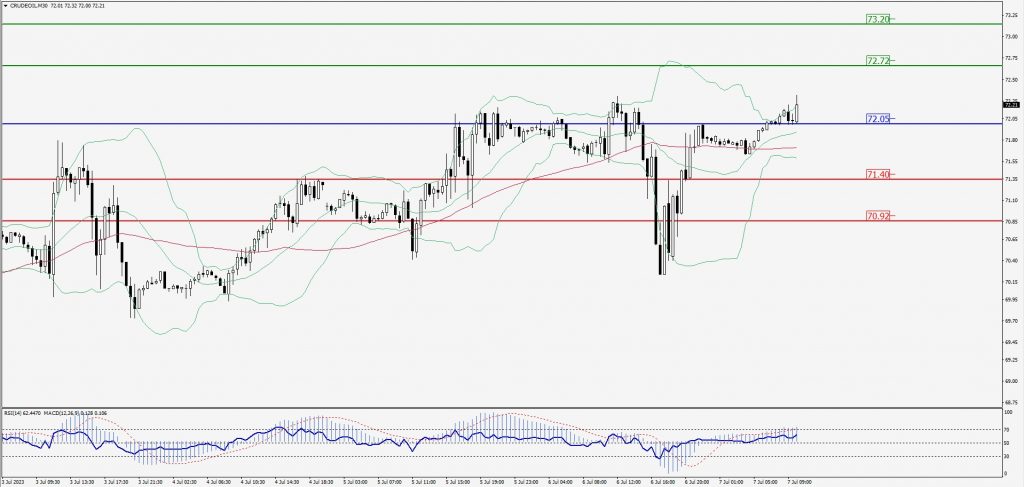
CRUDEOIL Intraday: Trend on the upside
Our pivot point is at 72.05
Preferable Price Action: Above pivot buy oil with 72.72 & 73.20 as targets.
Alternative Price Action: Sell crude below pivot with targets at 71.40 and 70.92 in extension.
Comment: MACD is positive territory and Pairs above its 20MA & 55MA.
Green Lines Indicate Resistance Levels – Red Lines Indicate Support Levels
Light Blue is a Pivot Point – Black represents the price when the report was produced
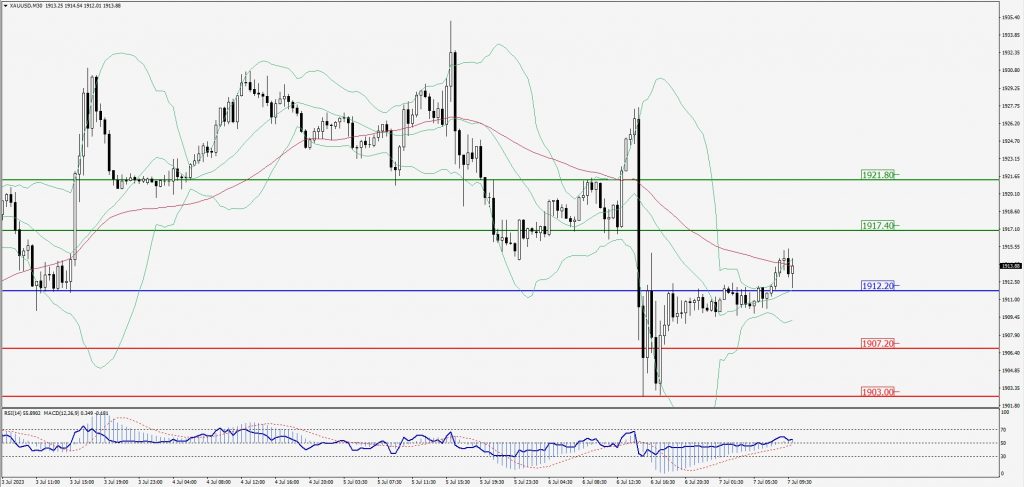
XAU/USD Intraday: Trend on the upside
Our pivot point is 1912.20
Preferable Price Action: Further upside to 1917.40 and 1921.80.
Alternative Price Action: If the price gives a downside breakout of a pivot, then the price extends to 1907.20 and 1903.00.
Comment: MACD is above 50 level and Pairs above 20MA.
Green Lines Indicate Resistance Levels – Red Lines Indicate Support Levels
Light Blue is a Pivot Point – Black represents the price when the report was produced
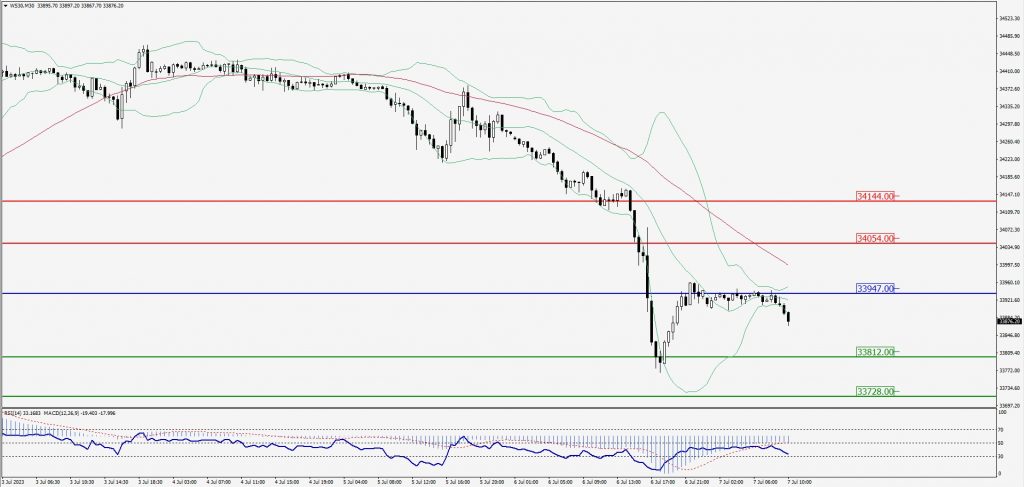
Dow Jones Intraday: Major trend on the downside
Our pivot point is 33,947.00
Preferable Price Action: Take sell positions below the pivot with targets at 33,812.00 & 33,728.00.
Alternative Price Action: Above 33,947.00 looks for further upside to 34,054.00 & 34,144.00.
Comment: RSI is below 50 levels and Pairs below its 20MA & 55MA.
Green Lines Indicate Resistance Levels – Red Lines Indicate Support Levels
Light Blue is a Pivot Point – Black represents the price when the report was produced