Market Wrap: Stocks, Bonds, Commodities
The U.S. dollar on Tuesday edged higher from its more than two-month lows against the euro, sterling and Swiss franc, as investors consolidated gains in other currencies ahead of a key nonfarm payrolls report later this week.
The Dow Jones Industrial Average rose 96.04 points to 38,807.33 , the S&P 500 gain 1.18% to 5,354.03 and the Nasdaq Composite ascend 329.34 points to 17,186.38 .
MSCI’s index of Asia-Pacific stocks outside Japan is above 0.99% to 689.08 levels. The Australian index was higher by 0.68% to 7,821.80. Japanese Nikkei Index increase 0.74% today.
European stocks were positive on Thursday, with the Stoxx Europe 50 Index increase 0.84% to 5,077.85 , Germany’s DAX ascend 1.02% to 18,759.85 , and France’s CAC higher 0.56% to 8,051.20 and U.K.’s FTSE 100 gain 0.28% to 8,270.39.
Benchmark 10-year U.S. Treasury rose as demand for safe assets slipped again, today 10-year bond yields increase 0.42% to 4.3030.
Oil prices settled higher Thursday , but that did little to prevent heavy weekly losses Thursday as concerns over sticky inflation and high interest rates spurred doubts that demand will remain robust this year.
Spot Brent crude oil ascend 0.54% to $78.83 per barrel. US West Texas Intermediate crude is up 0.62% to $74.53 a barrel.
The yellow metal gold is increase 0.19% to 2,379.90 dollars per ounce.
Market Wrap: Forex
The dollar fell against the safe-haven yen and Swiss franc on Tuesday as investors cut their exposure to riskier assets amid the partial U.S. government shutdown and signs of confrontation between the White House and the Federal Reserve.
Today, the U.S. dollar index measures the Greenback against a trade-weighted basket of six major currencies, which ascend 0.05% to 104.275.
The Euro US Dollar (EUR/USD) is a widely traded pair that is increase 0.05% today. This left the pair trading around $1.08730.
The Japanese yen was positive against the U.S. dollar on Thursday. Today USD/JPY is trades pair that increases 0.13% to the 156.310 level.
Another commodity-related currency negative against the U.S dollar, AUD/USD drop 0.03% to 0.66450 , and NZD/USD descend 0.18% to 0.61800 level.
EUR/USD Intraday: Trend on the downside
Our pivot point is at 1.08860.
Preferable Price Action: Take sell positions below pivot level with targets at 1.08710 & 1.08630 in extension.
Alternative Price Action: Buy pivot looks for a further upside to 1.09010 & 1.09090.
Comment: RSI is below 50 levels and pairs are below its 20MA .
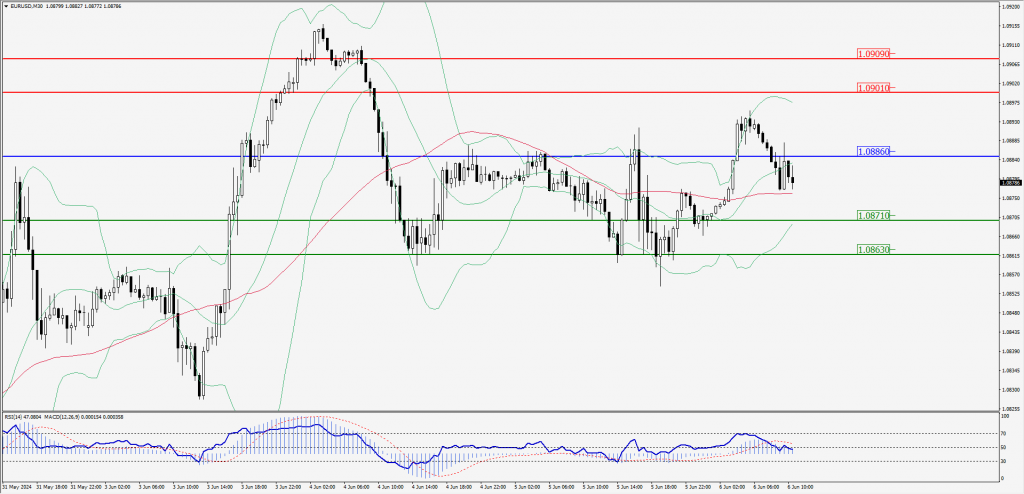
Green Lines Indicate Resistance Levels – Red Lines Indicate Support Levels
Light Blue is a Pivot Point – Black represents the price when the report was produced
GBP/USD Intraday: Trend on the downside
Our pivot point is at 1.28040
Preferable Price Action: Sell positions below pivot with targets at 1.27770 & 1.27530 in extension.
Alternative Price Action: The price above pivot would call for further upside to 1.28310 & 1.28530.
Comment: RSI is below 50 levels and pairs are below its 20MA .
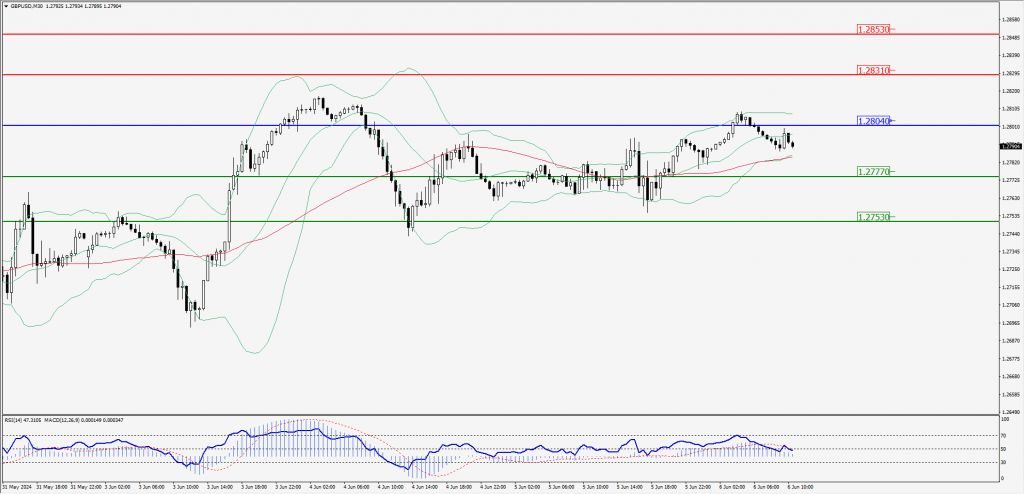
Green Lines Indicate Resistance Levels – Red Lines Indicate Support Levels
Light Blue is a Pivot Point – Black represents the price when the report was produced
USD/JPY Intraday: Trend on the upside
Our pivot point is at 156.150
Preferable Price Action: Buy position above pivot with the target at 156.680 and 157.000 in extension.
Alternative Price Action: The downside breakout of the pivot would call for 155.630 and 155.320.
Comment: MACD is above 50 levels and pairs above 20MA & 55MA.
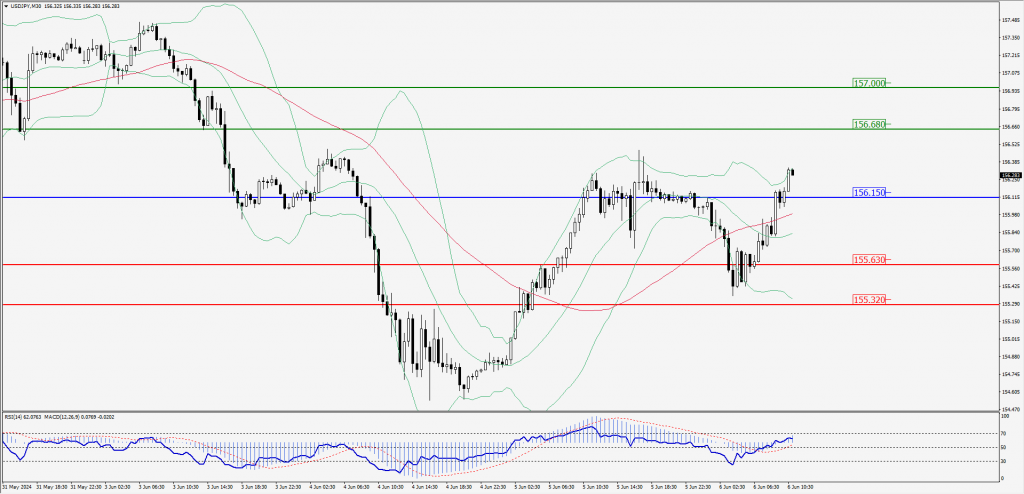
Green Lines Indicate Resistance Levels – Red Lines Indicate Support Levels
Light Blue is a Pivot Point – Black represents the price when the report was produced
AUD/USD Intraday: Trend on the downside
Our pivot point is at 0.66580
Preferable Price Action: Sell positions below pivot with targets at 0.66480 & 0.66410 in extension.
Alternative Price Action: Above pivot a further upside with 0.66680 & 0.66750 as targets.
Comment: RSI is below 50 levels and pairs below its 20MA.
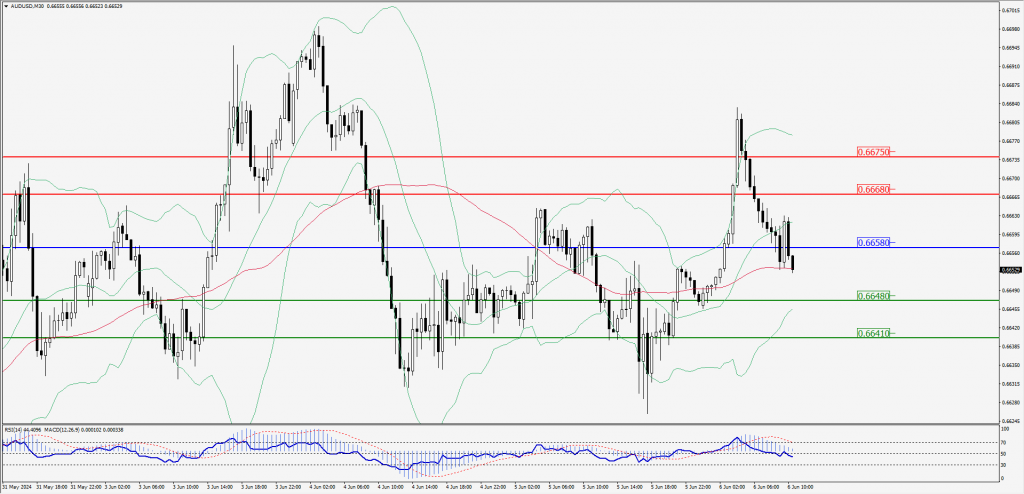
Green Lines Indicate Resistance Levels – Red Lines Indicate Support Levels
Light Blue is a Pivot Point – Black represents the price when the report was produced
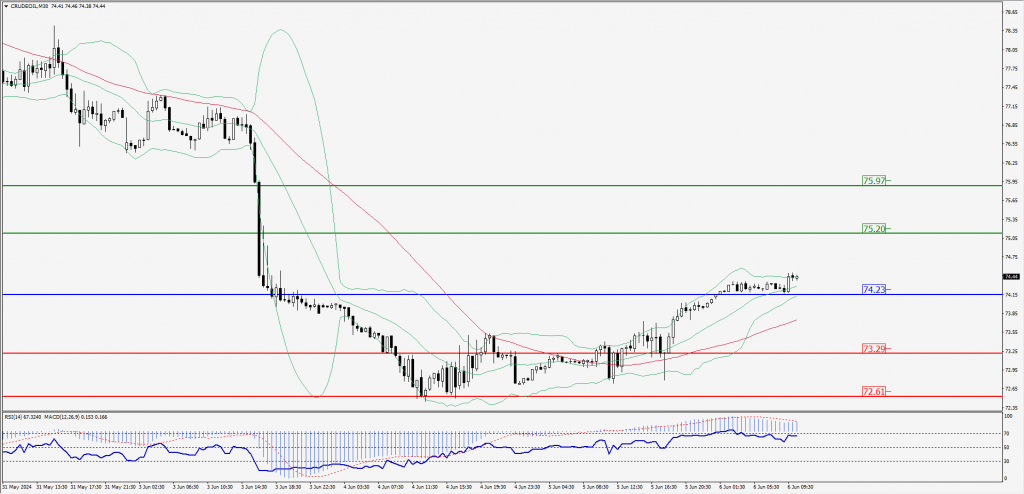
CRUDEOIL Intraday: Trend on the upside
Our pivot point is at 74.23.
Preferable Price Action: Above pivot buy oil with 75.20 & 75.97 as targets.
Alternative Price Action: Sell crude below pivot with targets at 73.29 and 72.61 in extension.
Comment: RSI is above 50 levels and pairs above 20MA & 55MA.
Green Lines Indicate Resistance Levels – Red Lines Indicate Support Levels
Light Blue is a Pivot Point – Black represents the price when the report was produced
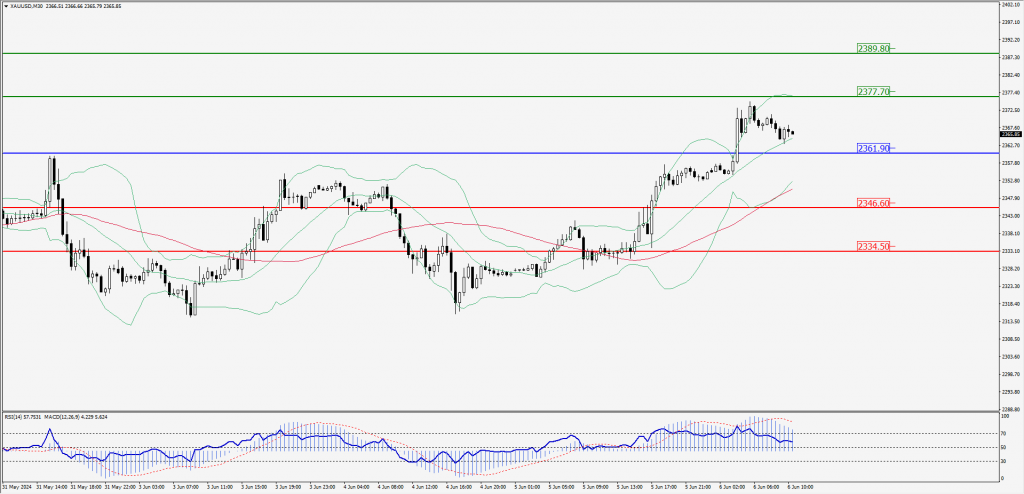
XAU/USD Intraday: Trend on the upside
Our pivot point is 2361.90
Preferable Price Action: Further upside to 2377.70 and 2389.80.
Alternative Price Action: If the price gives an downside breakout of a pivot, then the price extends to 2346.60 and 2334.50.
Comment: MACD is above 50 levels and pairs above its 20MA & 55MA.
Green Lines Indicate Resistance Levels – Red Lines Indicate Support Levels
Light Blue is a Pivot Point – Black represents the price when the report was produced
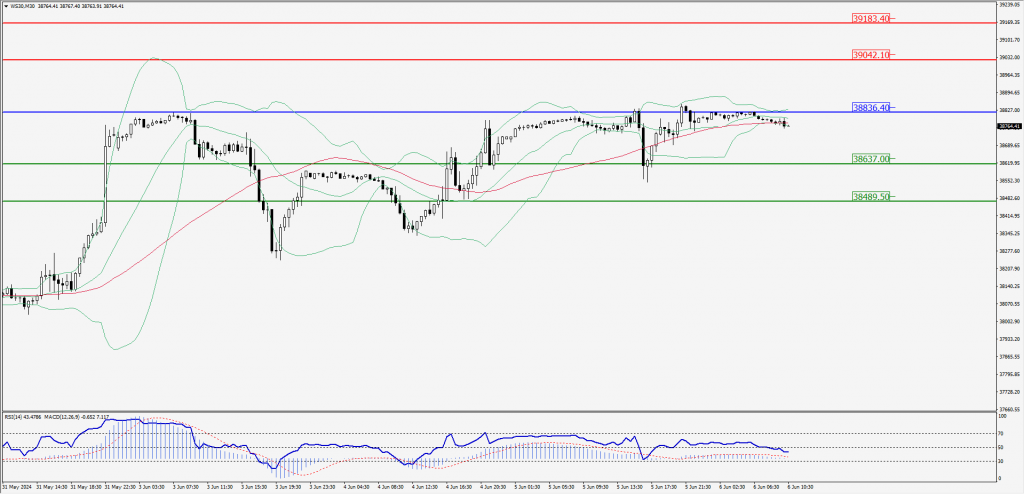
Dow Jones Intraday: Resistance level at 38,836.40
Our pivot point is 38,836.40.
Preferable Price Action: Take sell positions below the pivot with targets at 38,637.00 & 38,489.50.
Alternative Price Action: Above 38,836.40 looks for further upside to 39,042.10 & 39,183.40.
Comment: RSI is below 50 levels and pairs below its 20MA & 55MA.
Green Lines Indicate Resistance Levels – Red Lines Indicate Support Levels
Light Blue is a Pivot Point – Black represents the price when the report was produced