Market Wrap: Stocks, Bonds, Commodities
US stocks initially rose, extending a rally on Wednesday after Powell eased widely held expectations of a 50 basis-point hike in interest rates when policymakers meet in two weeks.
The S&P 500 Lost (0.53%) ended at 4,363.49 points, while the Nasdaq Composite fell 1.56% to 13,537.94. The Dow Jones Industrial was down 0.29% to 33,794.66.
MSCI’s index of Asia-Pacific stocks outside Japan is dropped 1.89% to 726.79 levels. Australian index lost 0.57% to 7,110.80. Japanese Nikkei Index down 2.23% to 25,985.47.
European stocks were Negative on Friday, with the Stoxx Europe 50 Index down 1.25% to 3,694.85 Germany’s DAX fell 1.41% to 13,504.60, and France’s CAC pulled down 1.31% to 6,294.61, and U.K.’s FTSE 100 dropped 0.66% to 7,190.86.
Benchmark 10-year U.S. Treasury fell as demand for safe assets lost again, today 10-year bond yields a negative 1.806.
Oil prices initially soared on Thursday as the Ukraine war sparked a run on commodities that raised fears of “stagflation” while equity markets fell as investors gauge the impact of the US Federal Reserve’s plans to tighten monetary policy.
Spot Brent crude oil rose 0.69% to $111.22 per barrel. US West Texas Intermediate crude up 0.96% to $108.70 a barrel.
The yellow metal gold is ascended to 0.22% to 1,940.30 dollars per ounce.
Market Wrap: Forex
The U.S. dollar traded higher while the euro headed for its worst week in nine months as the intensifying war in Ukraine prompted safe-haven flows as well as a hit to European growth expectations.
Today, the U.S. dollar index measures the Greenback against a trade-weighted basket of six major currencies, which is rose today 0.28% to 98.062.
The Euro US Dollar (EUR/USD) is a widely traded pair that is negative today. This left the pair trading around $1.10120.
The Japanese yen was negative against the U.S. dollar on Friday as the stock down. Today USD/JPY is lost 0.05% to 115.410 level.
Another commodity-related currency positive against the U.S dollar, AUD/USD gained 0.40% to 0.73580, and NZD/USD rose 0.40% to 0.68270 level.
EUR/USD Intraday: Major Trend on the Downside
Our pivot point is at 1.10750
Preferable Price Action: Take Short positions Below pivot level with targets at 1.09950 & 1.09270 in extension.
Alternative Price Action: Above pivot looks for a further Upside to 1.11550 & 1.12210.
Comment: RSI below 50 levels and Pair Below its 20MA & 55MA.
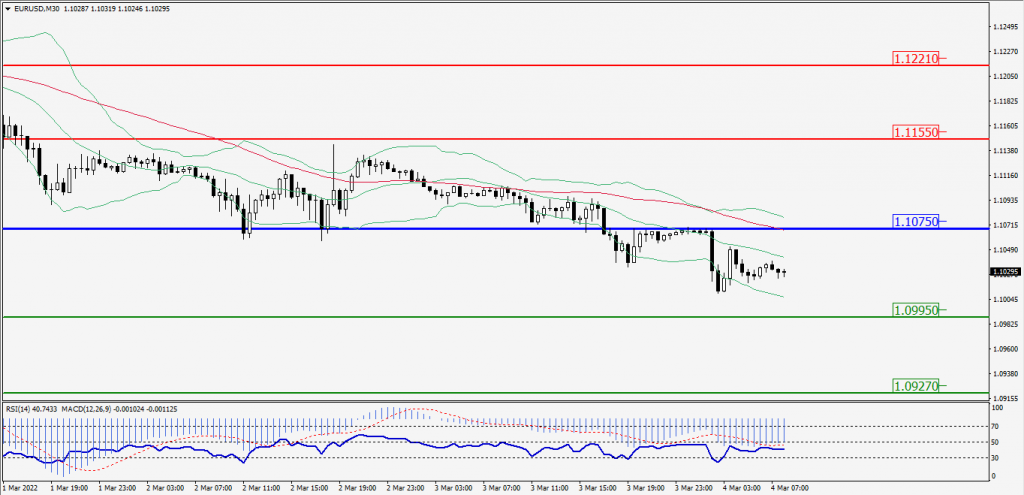
Green Lines Indicate Resistance Levels – Red Lines Indicates Support Levels
Light Blue is a Pivot Point – Black represents the price when the report was produced
GBP/USD Intraday: In a Consolidation Zone
Our pivot point is at 1.33620
Preferable Price Action: Sell positions Below pivot with targets at 1.33220 & 1.32890 in extension.
Alternative Price Action: The price Above pivot would call for further Upside to 1.34010 & 1.34330.
Comment: RSI Below 50 levels and Pair Below 55MA.
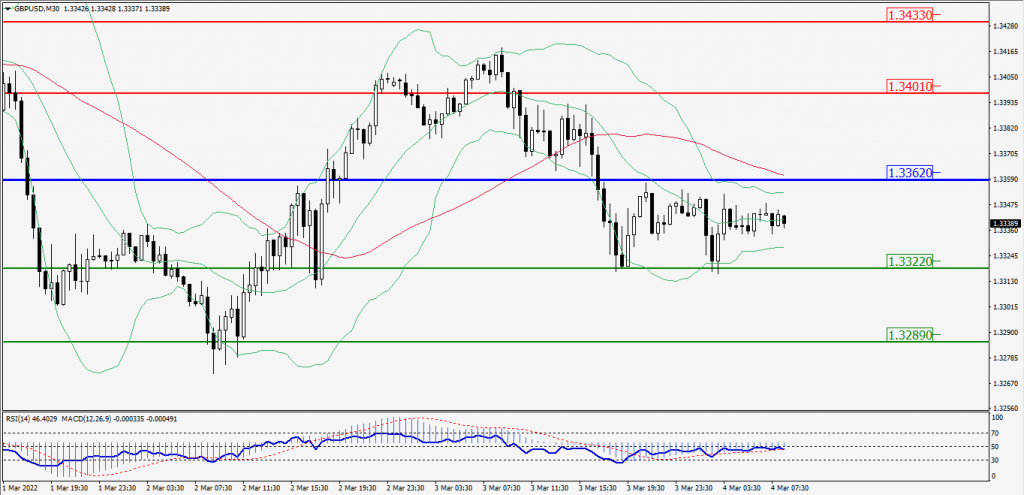
Green Lines Indicate Resistance Levels – Red Lines Indicates Support Levels
Light Blue is a Pivot Point – Black represents the price when the report was produced
USD/JPY Intraday: Resistance Level at 115.720
Our pivot point is at 115.720
Preferable Price Action: Sell position Below pivot with the target at 115.310 and 114.950 in extension.
Alternative Price Action: The Upside breakout of the pivot would call for 116.140 and 116.500.
Comment: MACD in Positive territory and Pair Below 55MA.
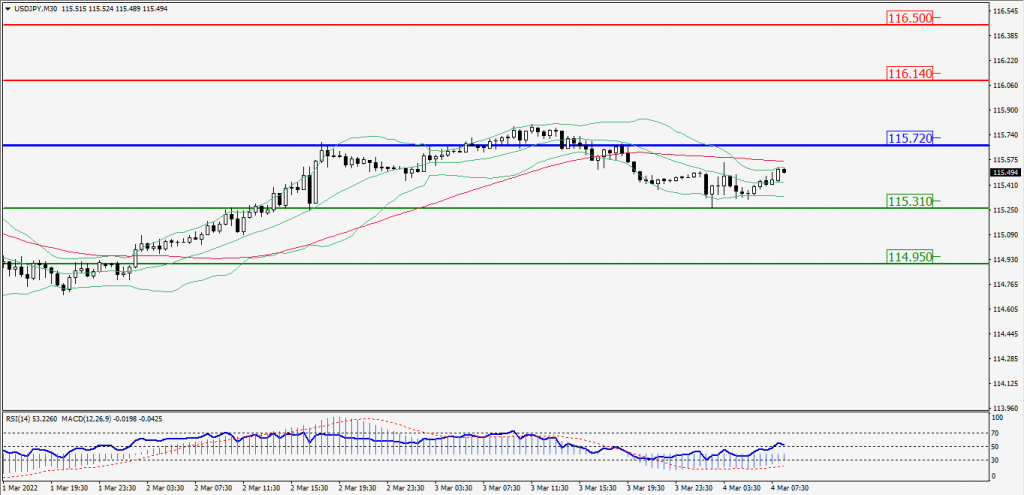
Green Lines Indicate Resistance Levels – Red Lines Indicates Support Levels
Light Blue is a Pivot Point – Black represents the price when the report was produced
AUD/USD Intraday: Trend on the Major Upside
Our pivot point is at 0.73340
Preferable Price Action: Buy Positions Above pivot with targets at 0.73830 & 0.74240 in extension.
Alternative Price Action: Below pivot looks for a further Downside with 0.72850 & 0.72450 as targets.
Comment: Pair Above its 20MA & 55MA and RSI above 50 levels.
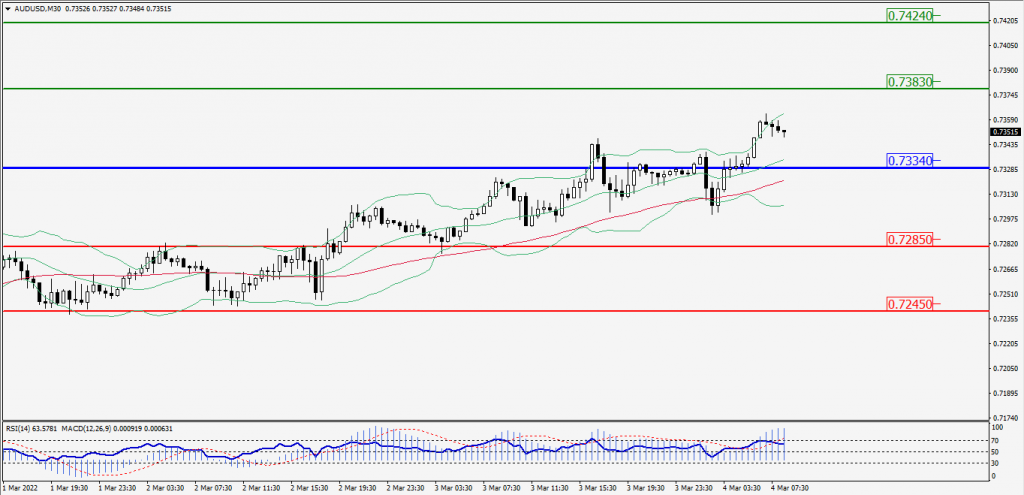
Green Lines Indicate Resistance Levels – Red Lines Indicates Support Levels
Light Blue is a Pivot Point – Black represents the price when the report was produced
CRUDEOIL Intraday: Resistance Level at 110.55
Our pivot point is at 110.55
Preferable Price Action: Below pivots Sell Oil with 104.15 & 98.90 as targets.
Alternative Price Action: Buy crude Above pivot with targets at 116.80 and 122.20 in extension.
Comment: MACD is in the Negative territory and Pair Below its 20MA & 55MA.
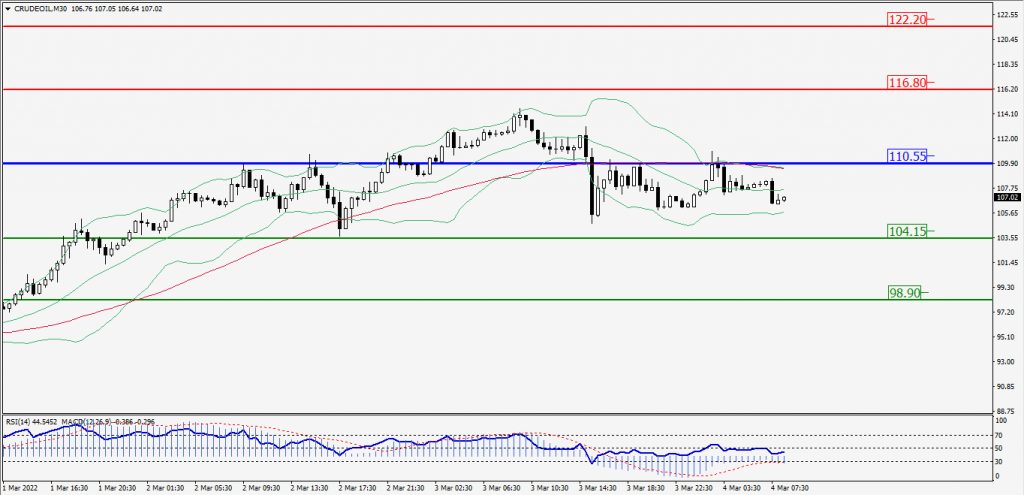
Green Lines Indicate Resistance Levels – Red Lines Indicates Support Levels
Light Blue is a Pivot Point – Black represents the price when the report was produced
XAU/USD Intraday: In a Consolidation Zone
Our pivot point is 1929.50
Preferable Price Action: Further Upside to 1945.70 and 1958.90.
Alternative Price Action: If the price gives a Downside breakout of a pivot, then the price extends to 1913.60 and 1900.70.
Comment: MACD is a Neutral territory and Pair Above 55MA.
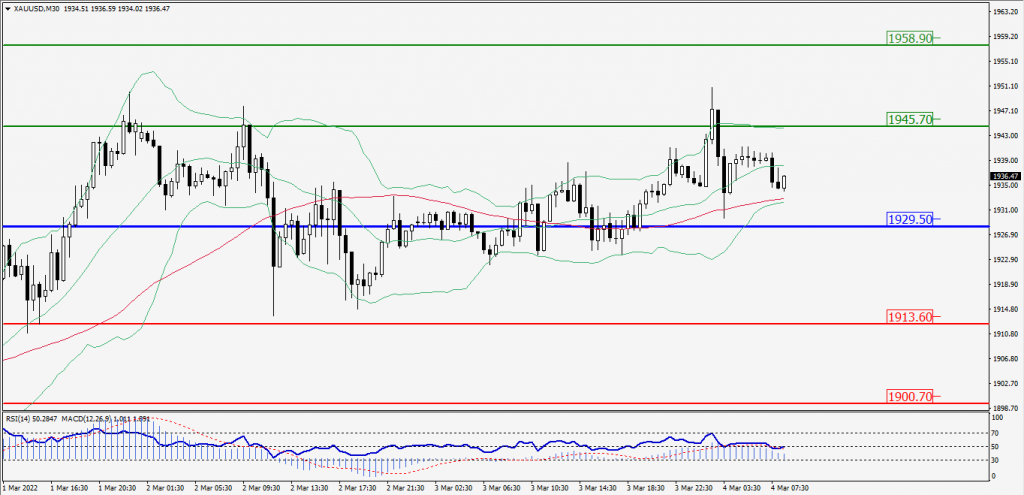
Green Lines Indicate Resistance Levels – Red Lines Indicates Support Levels
Light Blue is a Pivot Point – Black represents the price when the report was produced
Dow Jones Intraday: Major Resistance Level at 33,967.00
Our pivot point is 33,967.00
Preferable Price Action: Take Short positions Below pivot with targets at 33,454.00 & 33,022.00.
Alternative Price Action: Above 33,967.00 looks for further upside to 34,490.00 & 34,922.00.
Comment: Price Below 55MA and RSI at 50 levels.
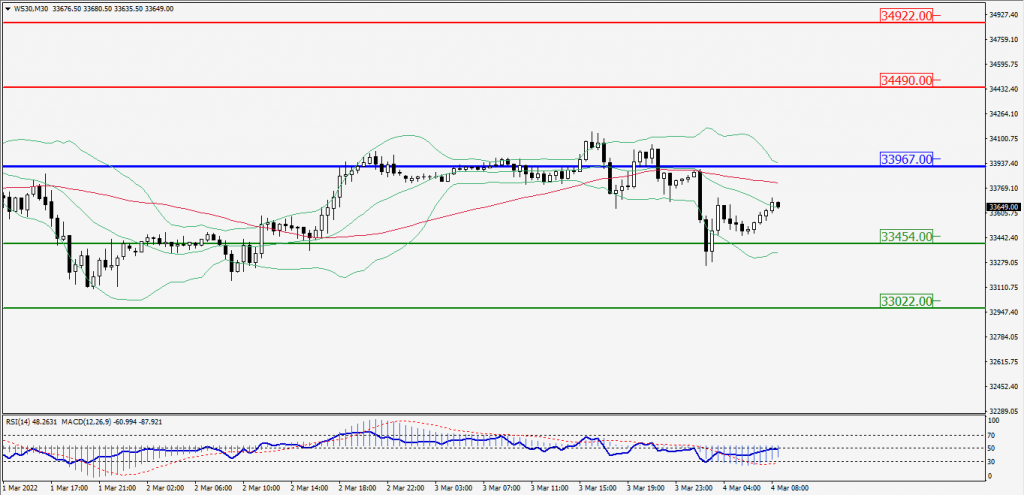
Green Lines Indicate Resistance Levels – Red Lines Indicates Support Levels
Light Blue is a Pivot Point – Black represents the price when the report was produced