Market Wrap: Stocks, Bonds, Commodities
Stocks tumbled on Tuesday as traders’ fears around contagion in the regional banking sector returned ahead of the Federal Reserve’s rate decision.
The Dow Jones Industrial Average fell 367.17 points to 33,684.53, the S&P 500 lose 1.16% to 4,119.58 and the Nasdaq Composite subtract 132.09 points to 12,080.51.
MSCI’s index of Asia-Pacific stocks outside Japan is decline 0.72% to 626.04 levels. The Australian index was lower by 0.96% to 7,197.40. Japanese Nikkei Index advance 0.12% today.
European stocks were negative on Wednesday, with the Stoxx Europe 50 Index rose 0.62% to 4,320.55, Germany’s DAX advance 0.58% to 15,816.15, and France’s CAC ascend 0.66% to 7,432.16, and U.K.’s FTSE 100 add 0.26% to 7,793.70.
Benchmark 10-year U.S. Treasury fell as demand for safe assets ascend again, today 10-year bond yields negative 1.15% to 3.3990.
Oil prices sank about 5 percent to a five-week low on Tuesday on concerns about the economy as U.S. politicians discuss ways to avoid a debt default and investors prepare for more rate hikes this week.
Spot Brent crude oil drop 1.90% to $73.89 per barrel. US West Texas Intermediate crude is down 2.01% to $70.17 a barrel.
The yellow metal gold is advance 0.11% to 2,025.45 dollars per ounce.
Market Wrap: Forex
The U.S. dollar slipped lower in early European trade Wednesday ahead of the conclusion of the Federal Reserve’s two-day policy meeting and after downbeat jobs data.
Today, the U.S. dollar index measures the Greenback against a trade-weighted basket of six major currencies, which slipped 0.43% to 101.290.
The Euro US Dollar (EUR/USD) is a widely traded pair that is up 0.43% today. This left the pair trading around $1.10460.
The Japanese yen was negative against the U.S. dollar on Wednesday. Today USD/JPY is slipped 0.66% to the 135.660 level.
Another commodity-related currency mixed against the U.S dollar, AUD/USD fell 0.02% to 0.66600, and NZD/USD surged 0.44% to 0.62350 level.
EUR/USD Intraday: Trend on the upside
Our pivot point is at 1.10220
Preferable Price Action: Take buy positions above pivot level with targets at 1.10570 & 1.10790 in extension.
Alternative Price Action: Below pivot looks for a further downside to 1.09890 & 1.09680.
Comment: RSI is above 50 levels and Pairs above its 20MA & 55MA.
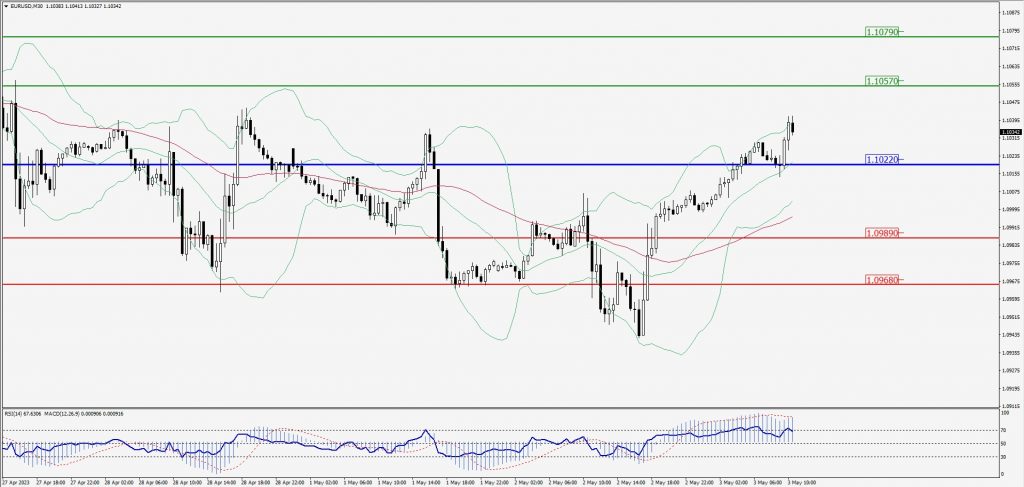
Green Lines Indicate Resistance Levels – Red Lines Indicate Support Levels
Light Blue is a Pivot Point – Black represents the price when the report was produced
GBP/USD Intraday: Major trend on the upside
Our pivot point is at 1.25060
Preferable Price Action: Buy positions above pivot with targets at 1.25350 & 1.25560 in extension.
Alternative Price Action: The price below pivot would call for further downside to 1.24780 & 1.24590.
Comment: RSI is above 50 levels and Pairs above its 20MA & 55MA.
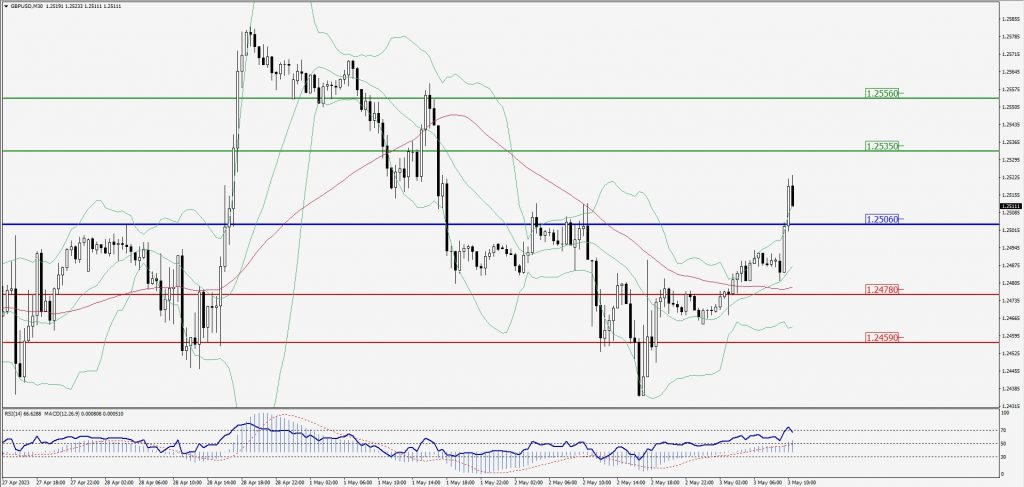
Green Lines Indicate Resistance Levels – Red Lines Indicate Support Levels
Light Blue is a Pivot Point – Black represents the price when the report was produced
USD/JPY Intraday: Trend on the downside
Our pivot point is at 136.160
Preferable Price Action: Sell position below pivot with the target at 135.240 and 134.680 in extension.
Alternative Price Action: The upside breakout of the pivot would call for 136.990 and 137.580.
Comment: MACD is below 50 level and Pairs below its 20MA & 55MA.
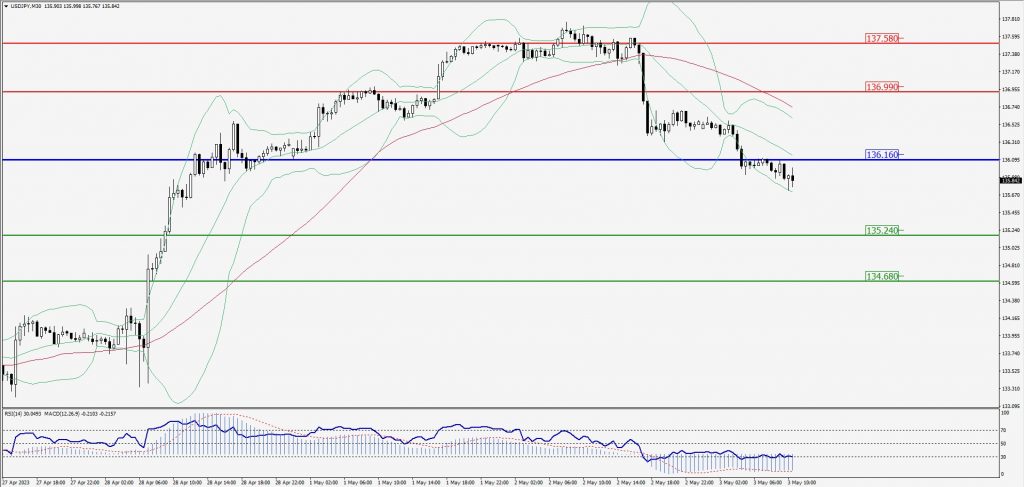
Green Lines Indicate Resistance Levels – Red Lines Indicate Support Levels
Light Blue is a Pivot Point – Black represents the price when the report was produced
AUD/USD Intraday: Resistance level at 0.66730
Our pivot point is at 0.66730
Preferable Price Action: Sell positions below pivot with targets at 0.66470 & 0.66310 in extension.
Alternative Price Action: Above pivot looks for a further upside with 0.66960 & 0.67100 as targets.
Comment: RSI is below 50 levels and Pairs below 55MA.
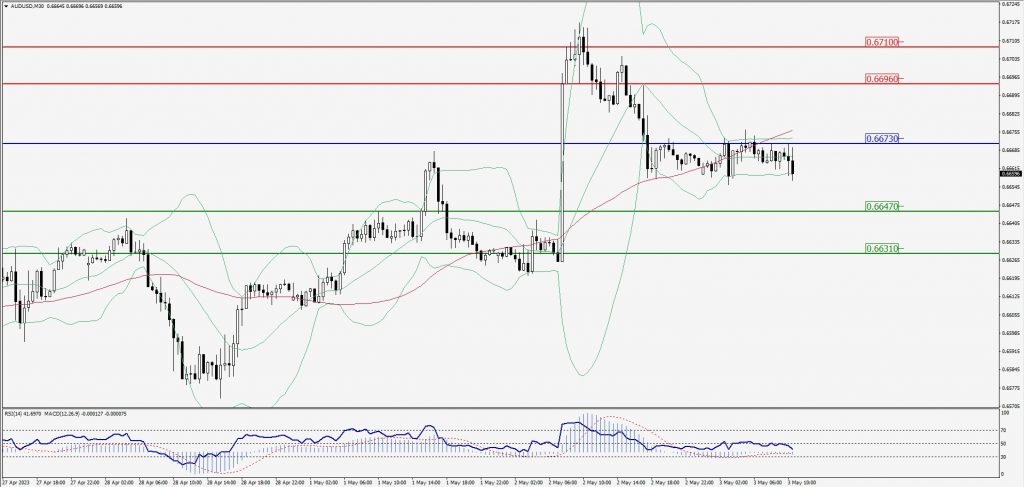
Green Lines Indicate Resistance Levels – Red Lines Indicate Support Levels
Light Blue is a Pivot Point – Black represents the price when the report was produced
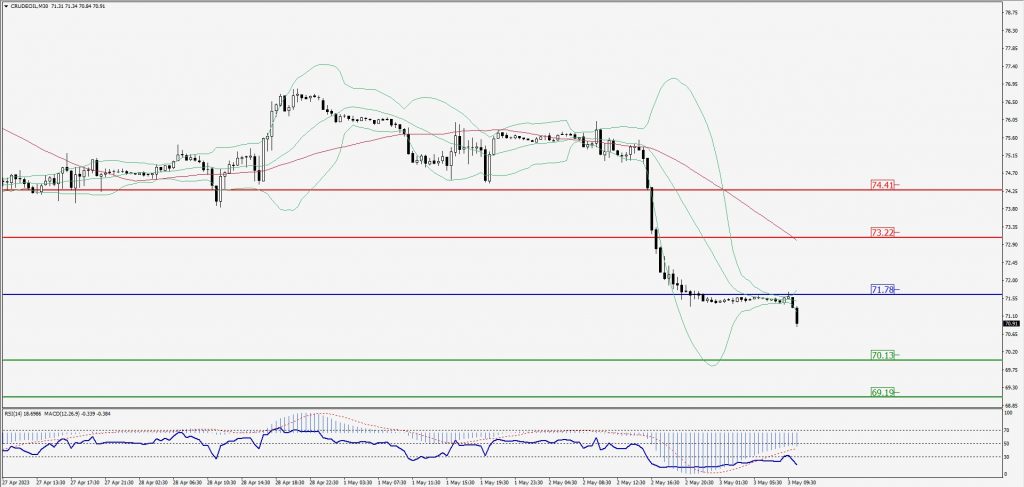
CRUDEOIL Intraday: Major trend on the downside
Our pivot point is at 71.78
Preferable Price Action: Below pivot sell oil with 70.13 & 69.19 as targets.
Alternative Price Action: Buy crude above pivot with targets at 73.22 and 74.41 in extension.
Comment: MACD is negative territory and Pairs below its 20MA & 55MA.
Green Lines Indicate Resistance Levels – Red Lines Indicate Support Levels
Light Blue is a Pivot Point – Black represents the price when the report was produced
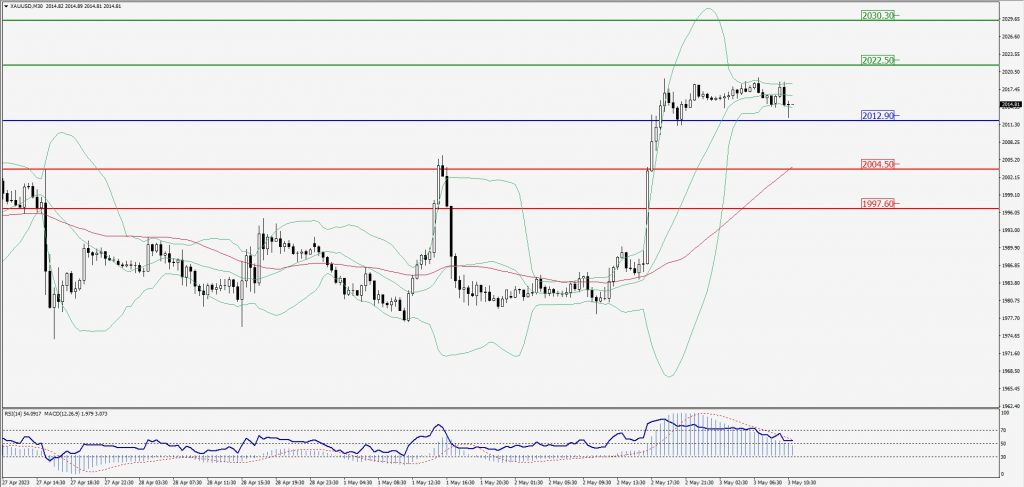
XAU/USD Intraday: Trend on the upside
Our pivot point is 2012.90
Preferable Price Action: Further upside to 2022.50 and 2030.30
Alternative Price Action: If the price gives a downside breakout of a pivot, then the price extends to 2004.50 and 1997.60.
Comment: MACD is above 50 level and Pairs above its 20MA & 55MA.
Green Lines Indicate Resistance Levels – Red Lines Indicate Support Levels
Light Blue is a Pivot Point – Black represents the price when the report was produced
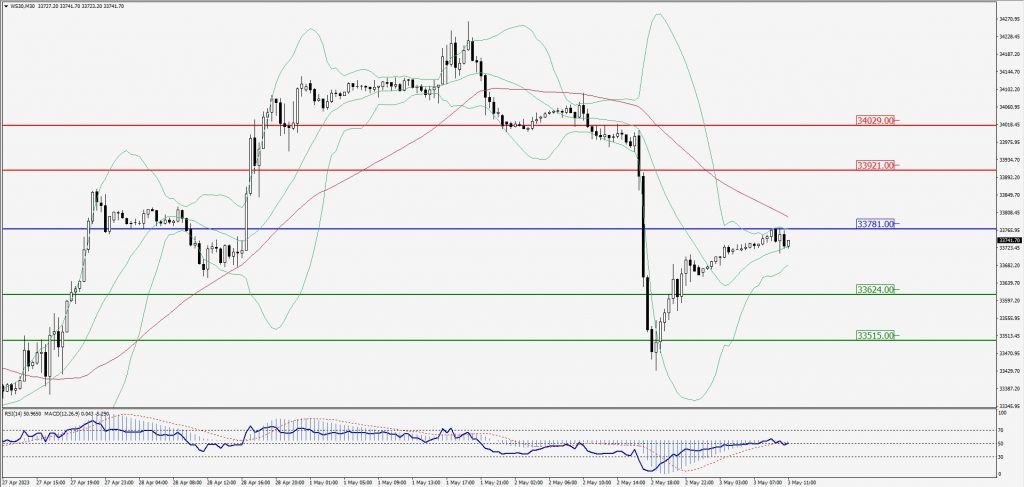
Dow Jones Intraday: In a consolidation zone
Our pivot point is 33,781.00
Preferable Price Action: Take sell positions below the pivot with targets at 33,624.00 & 33,515.00.
Alternative Price Action: Above 33,781.00 looks for further upside to 33,921.00 & 34,029.00.
Comment: RSI is below 50 levels and Pairs below 55MA.
Green Lines Indicate Resistance Levels – Red Lines Indicate Support Levels
Light Blue is a Pivot Point – Black represents the price when the report was produced