Market Wrap: Stocks, Bonds, Commodities
Wall Street’s three major indexes advanced solidly on Friday, with the tech-heavy Nasdaq boasting its biggest first-half gain in 40 years as inflation showed signs of cooling while Apple closed with a $3 trillion market valuation for the first time.
The Dow Jones Industrial Average rose 285.18 points to 34,407.60, the S&P 500 gain 1.23% to 4,450.38 and the Nasdaq Composite add 1.45 points to 13,787.92.
MSCI’s index of Asia-Pacific stocks outside Japan is advance 1.54% to 640.34 levels. The Australian index was higher by 0.59% to 7,246.10. Japanese Nikkei Index advance 1.70% today.
European stocks were positive on Monday, with the Stoxx Europe 50 Index rose 0.29% to 4,411.65, Germany’s DAX advance 0.06% to 16,160.05, and France’s CAC ascend 0.07% to 7,405.71 and U.K.’s FTSE 100 add 0.21% to 7,547.04.
Benchmark 10-year U.S. Treasury fell as demand for safe assets ascend again, today 10-year bond yields positive 0.63% to 3.8430.
Oil prices slipped in early Asian trade on Monday as global macroeconomic headwinds and possible further interest rate hikes from the U.S. Federal Reserves offset forecasts of tighter supplies amid OPEC+ cuts.
Spot Brent crude oil ascend 1.41% to $76.42 per barrel. US West Texas Intermediate crude is up 1.37% to $71.62 a barrel.
The yellow metal gold is decline 0.46% to 1,920.55 dollars per ounce.
Market Wrap: Forex
The U.S. dollar edged higher in early European trade Monday, partially recovering after Friday’s losses in the wake of softer-than-expected inflation data as a holiday-shortened week gets underway.
Today, the U.S. dollar index measures the Greenback against a trade-weighted basket of six major currencies, which surged 0.28% to 102.870.
The Euro US Dollar (EUR/USD) is a widely traded pair that is down 0.29% today. This left the pair trading around $1.08780.
The Japanese yen was negative against the U.S. dollar on Monday. Today USD/JPY is surged 0.19% to the 144.590 level.
Another commodity-related currency mixed against the U.S dollar, AUD/USD fell 0.18% to 0.66540, and NZD/USD surged 0.36% to 0.61450 level.
EUR/USD Intraday: Trend on the downside
Our pivot point is at 1.09060
Preferable Price Action: Take sell positions below pivot level with targets at 1.08660 & 1.08400 in extension.
Alternative Price Action: Above pivot looks for a further upside to 1.09400 & 1.09660.
Comment: RSI is below 50 levels and Pairs below 20MA.
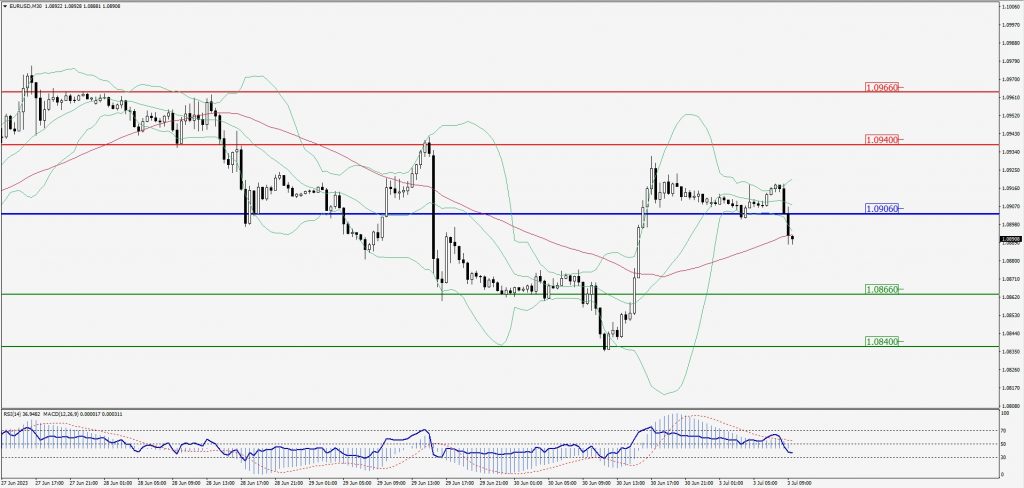
Green Lines Indicate Resistance Levels – Red Lines Indicate Support Levels
Light Blue is a Pivot Point – Black represents the price when the report was produced
GBP/USD Intraday: Trend on the downside
Our pivot point is at 1.26960
Preferable Price Action: Sell positions below pivot with targets at 1.26550 & 1.26320 in extension.
Alternative Price Action: The price above pivot would call for further upside to 1.27340 & 1.27600.
Comment: RSI is below 50 levels and Pairs below 20MA.
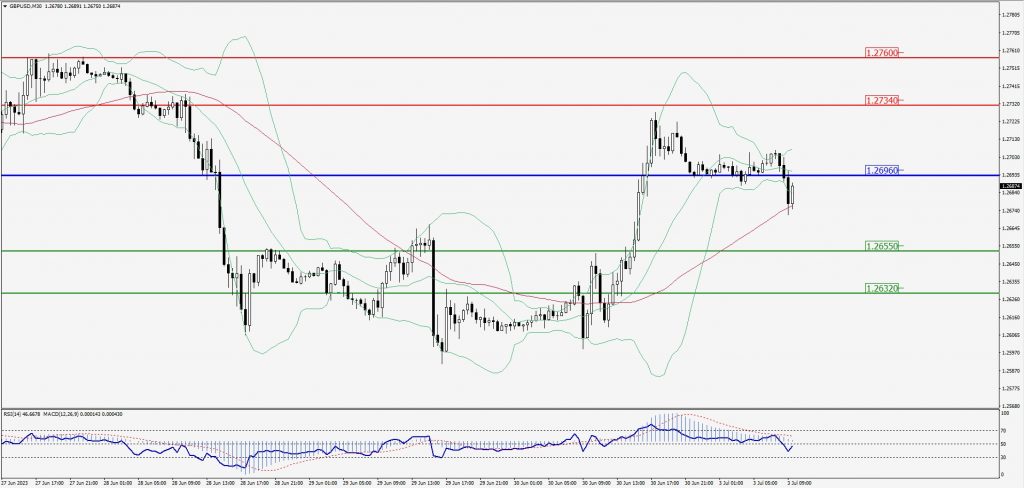
Green Lines Indicate Resistance Levels – Red Lines Indicate Support Levels
Light Blue is a Pivot Point – Black represents the price when the report was produced
USD/JPY Intraday: Support level at 144.630
Our pivot point is at 144.630
Preferable Price Action: Buy position above pivot with the target at 145.060 and 145.370 in extension.
Alternative Price Action: The downside breakout of the pivot would call for 144.250 and 143.970.
Comment: MACD is above 50 level and Pairs above its 20MA & 55MA.
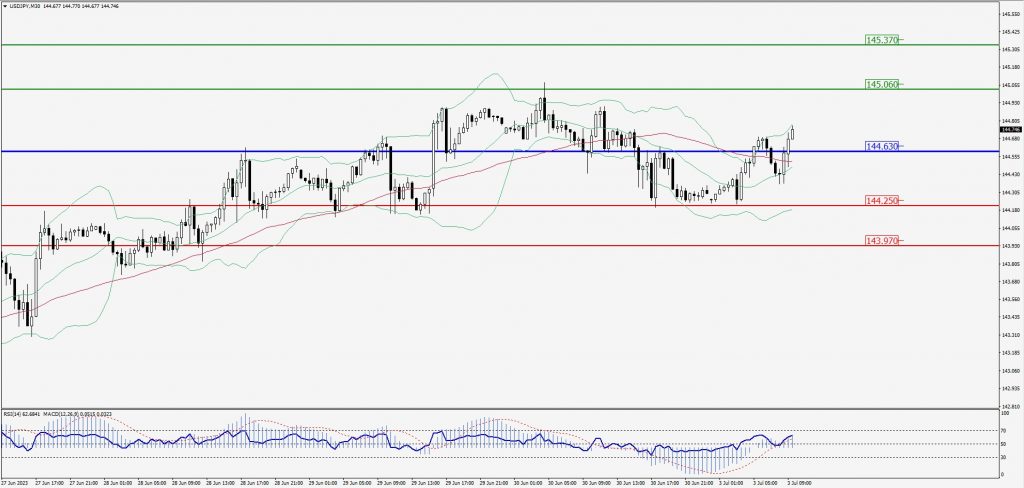
Green Lines Indicate Resistance Levels – Red Lines Indicate Support Levels
Light Blue is a Pivot Point – Black represents the price when the report was produced
AUD/USD Intraday: Trend on the upside
Our pivot point is at 0.66600
Preferable Price Action: Sell positions below pivot with targets at 0.66300 & 0.66130 in extension.
Alternative Price Action: Above pivot looks for a further upside with 0.66840 & 0.67020 as targets.
Comment: RSI is below 50 levels and Pairs below 20MA.
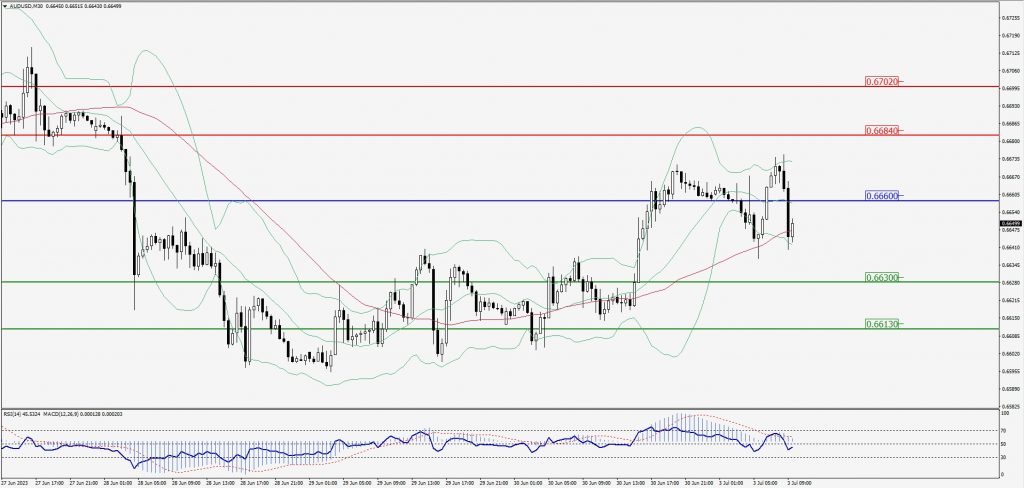
Green Lines Indicate Resistance Levels – Red Lines Indicate Support Levels
Light Blue is a Pivot Point – Black represents the price when the report was produced
CRUDEOIL Intraday: Resistance level at 70.82
Our pivot point is at 70.82
Preferable Price Action: Below pivot sell oil with 69.94 & 69.33 as targets.
Alternative Price Action: Buy crude above pivot with targets at 71.62 and 72.25 in extension.
Comment: MACD is negative territory and Pairs below 20MA.
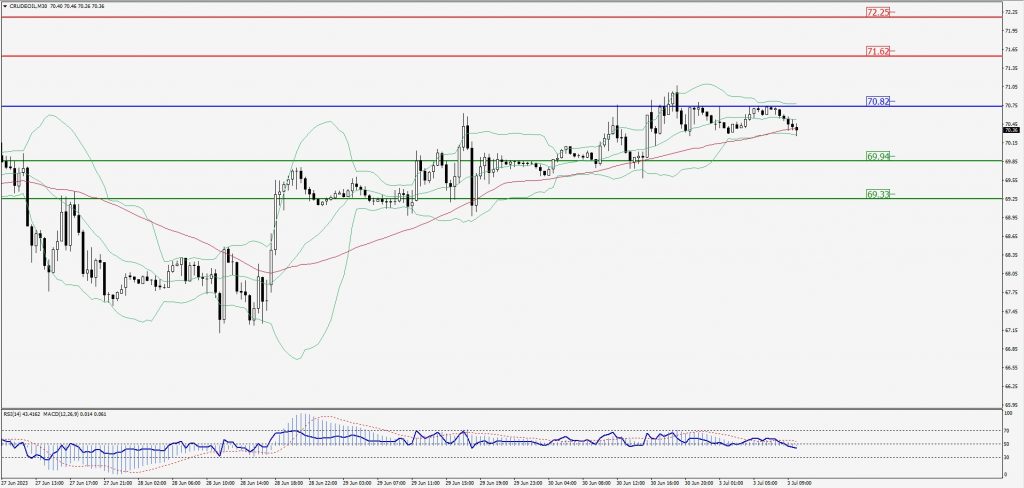
Green Lines Indicate Resistance Levels – Red Lines Indicate Support Levels
Light Blue is a Pivot Point – Black represents the price when the report was produced
XAU/USD Intraday: Trend on the downside
Our pivot point is 1918.80
Preferable Price Action: Further downside to 1909.60 and 1903.20.
Alternative Price Action: If the price gives an upside breakout of a pivot, then the price extends to 1926.60 and 1932.20.
Comment: MACD is below 50 level and Pairs below 20MA.
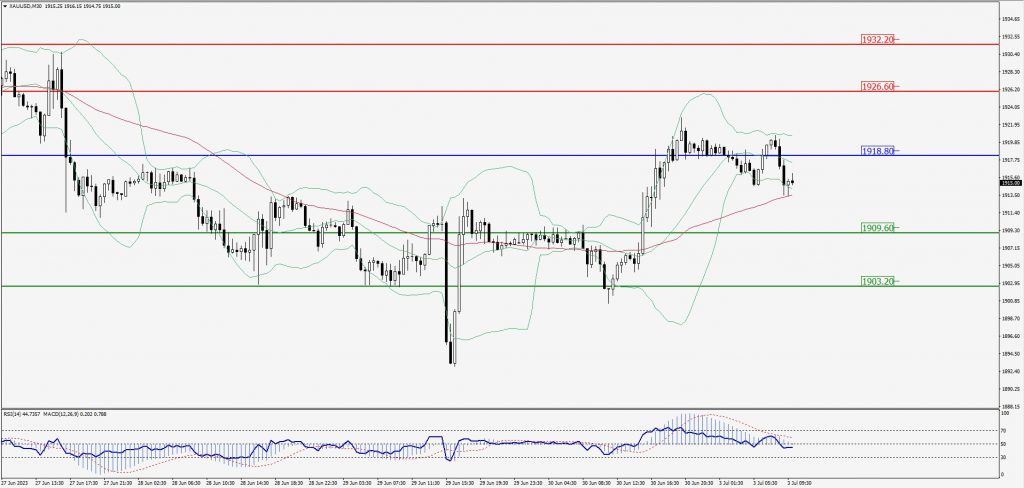
Green Lines Indicate Resistance Levels – Red Lines Indicate Support Levels
Light Blue is a Pivot Point – Black represents the price when the report was produced
Dow Jones Intraday: Trend on the upside
Our pivot point is 34,392.00
Preferable Price Action: Take buy positions above the pivot with targets at 34,533.00 & 34,629.00.
Alternative Price Action: Below 34,392.00 looks for further downside to 34,270.00 & 34,184.00.
Comment: RSI is above 50 levels and Pairs above 55MA.
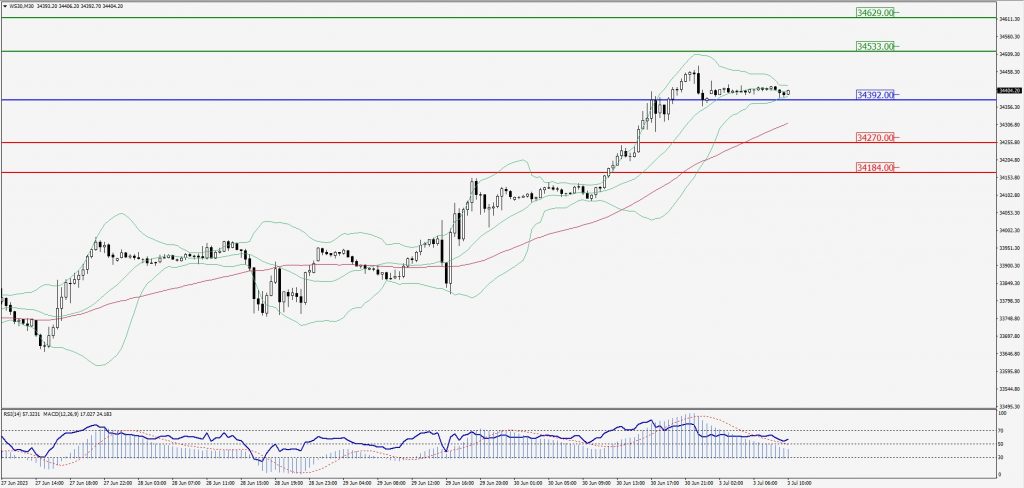
Green Lines Indicate Resistance Levels – Red Lines Indicate Support Levels
Light Blue is a Pivot Point – Black represents the price when the report was produced