Market Wrap: Stocks, Bonds, Commodities
A broad rally sent Wall Street to a sharply higher close on Thursday, recovering ground lost over recent sessions as market participants snapped up bargains while digesting the implications of a shifting pandemic.
The Dow Jones Industrial Average rose 617.75 points (1.82%) to 34,639.79, the S&P 500 gained 64.06 points (1.42%) to 4,577.1 and the Nasdaq Composite added 127.27 points (0.83%) to 15,381.32.
MSCI’s index of Asia-Pacific stocks outside Japan lost 0.46% to 790.26 levels. Australian index rose 0.22% to 7,241.20. Japanese Nikkei Index advances 1.00% to 28,030.57.
European stocks were higher on Friday, with the Stoxx Europe 50 Index jumping 0.32% to 4,120.55, Germany’s DAX rose 0.34% to 15,317.35, and France’s CAC advance 0.30% to 6,816.34, and U.K.’s FTSE 100 rose 0.21% to 7,144.50.
Benchmark 10-year U.S. Treasury rose as demand for safe assets grows again, today 10-year bond yields fell 0.67% to 1.439.
Oil prices settled more than 1%higher on Thursday, after a see-saw session that saw benchmarks swing in a $5 range after OPEC+ surprised markets by sticking to its plans to boost output slowly.
Spot Brent crude oil gained 1.87% to $70.96 per barrel. US West Texas Intermediate crude rose 1.97% to $67.82 a barrel.
The yellow metal gold is higher than 0.50% to 1771.60 dollars per ounce.
Market Wrap: Forex
The dollar ticked higher on Friday amid a broadly calmer tone in markets as fears over Omicron’s impact eased, but currency moves were muted ahead of a key US payrolls report that could clear the path to earlier Federal Reserve interest rate hikes.
Today, the U.S. dollar index measures the greenback against a trade-weighted basket of six major currencies, which advanced 0.13% to 96.280.
The Euro US Dollar (EUR/USD) is a widely traded pair that is slipped 0.12% today. This left the pairing trading around $1.12840.
The Japanese yen fell against the U.S. dollar on Friday as the stock pushes lower. Today US/JPY is rose 0.15% to 113.310 level.
Another commodity-related currency lower against the U.S dollar, AUD/USD lost 0.42% to 0.70620, and NZD/USD down 0.53% to 0.67780 level.
EUR/USD Intraday: Resistance at 1.13130
Our pivot point is at 1.13130
Preferable Price Action: Take Short positions Below pivot level with targets at 1.12760 & 1.12590 in extension.
Alternative Price Action: Above pivot looks for a further Upside to 1.13530 & 1.13690.
Comment: Pair below its 55MA & 20MA and RSI below 50 levels.
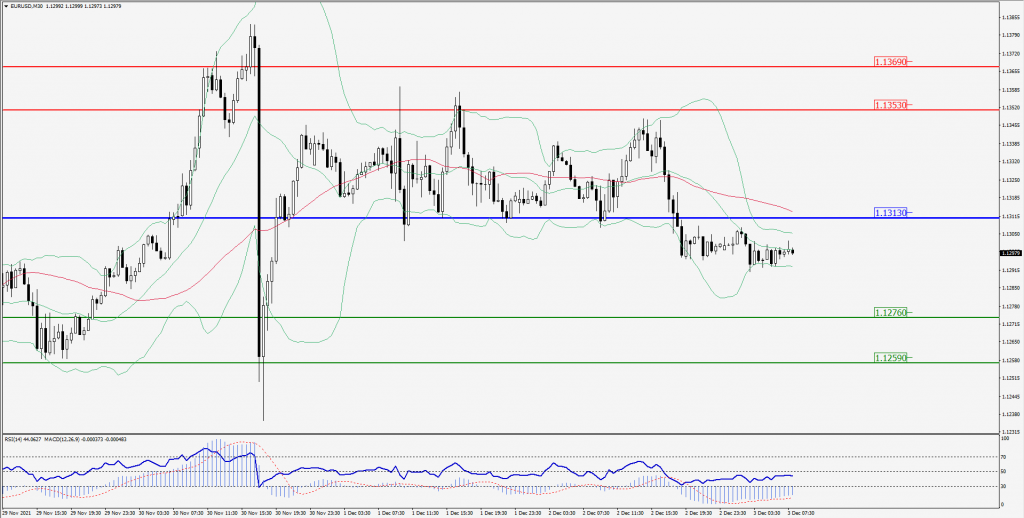
Green Lines Indicate Resistance Levels – Red Lines Indicates Support Levels
Light Blue is a Pivot Point – Black represents the price when the report was produced
GBP/USD Intraday: Resistance at 1.33230
Our pivot point is at 1.33230
Preferable Price Action: Sell positions below pivot with targets at 1.32660 & 1.32360 in extension.
Alternative Price Action: The price above pivot would call for further upside to 1.33830 & 1.34060.
Comment: Pair below its 55MA and RSI at 50 levels.
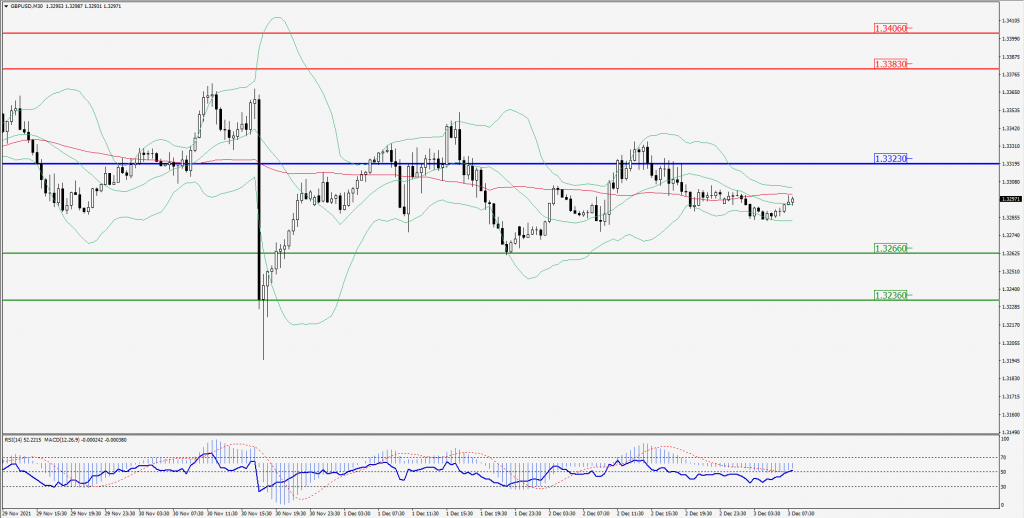
Green Lines Indicate Resistance Levels – Red Lines Indicates Support Levels
Light Blue is a Pivot Point – Black represents the price when the report was produced
USD/JPY Intraday: In a consolidation zone
Our pivot point is at 113.060
Preferable Price Action: Buy position Above pivot with the target at 113.530 and 113.760 in extension.
Alternative Price Action: The Downside breakout of the pivot would call for 112.590 and 112.390.
Comment: Price above its 55MA & 20MA and MACD in positive territory.
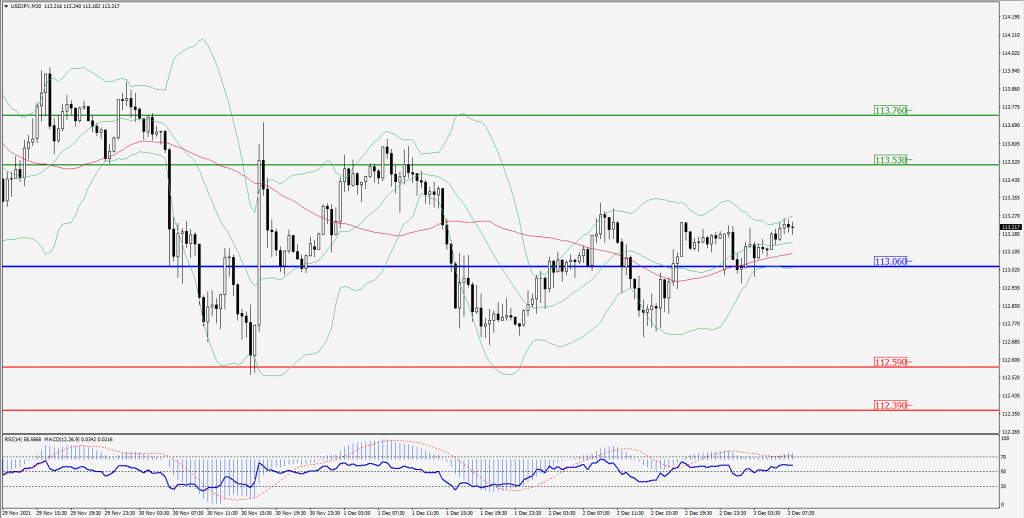
Green Lines Indicate Resistance Levels – Red Lines Indicates Support Levels
Light Blue is a Pivot Point – Black represents the price when the report was produced
AUD/USD Intraday: Trend on the downside
Our pivot point is at 0.71060
Preferable Price Action: Sell Positions below pivot with targets at 0.70490 & 0.70230 in extension.
Alternative Price Action: Above pivot looks for a further upside with 0.71660 & 0.71990 as targets.
Comment: Pair below its 55MA & 20MA and RSI below 50 levels.
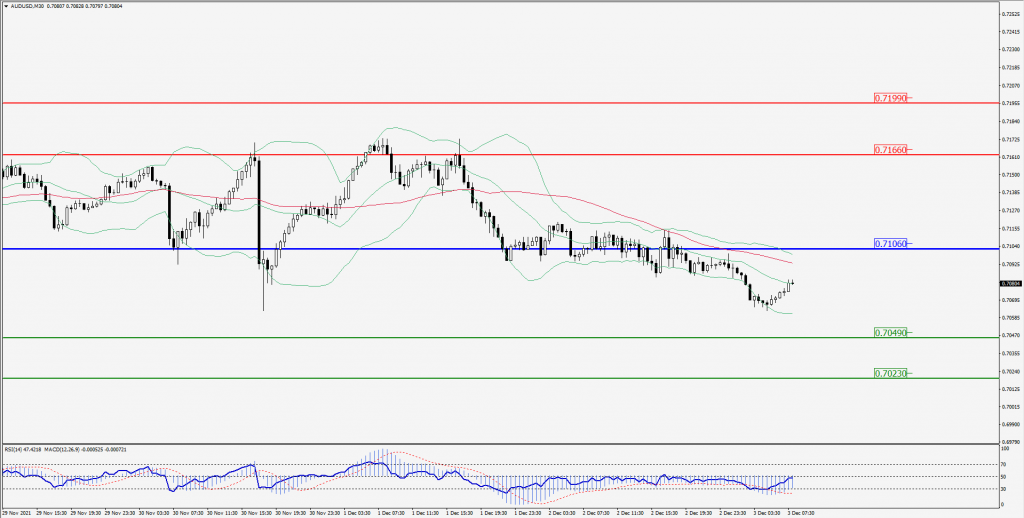
Green Lines Indicate Resistance Levels – Red Lines Indicates Support Levels
Light Blue is a Pivot Point – Black represents the price when the report was produced
CRUDEOIL Intraday: Price may bounce back from here
Our pivot point is at 65.90
Preferable Price Action: Above pivots Buy Oil with 70.30 & 72.60 as targets.
Alternative Price Action: Sell crude Below pivot with targets at 61.90 and 59.60 in extension.
Comment: Crude is above its 20MA and MACD in the positive territory.
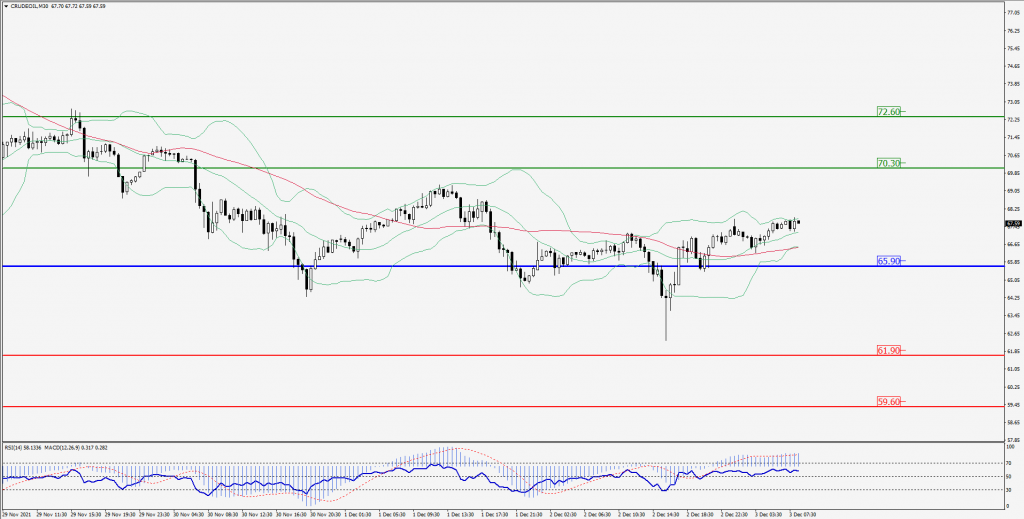
Green Lines Indicate Resistance Levels – Red Lines Indicates Support Levels
Light Blue is a Pivot Point – Black represents the price when the report was produced
XAU/USD Intraday: Support at 1769.00
Our pivot point is 1769.00
Preferable Price Action: Further upside to 1789.30 and 1798.60.
Alternative Price Action: If the price gives an downside breakout of a pivot, then the price extends to 1749.30 and 1740.60.
Comment: MACD in positive territory and price above its 20MA & 55MA.
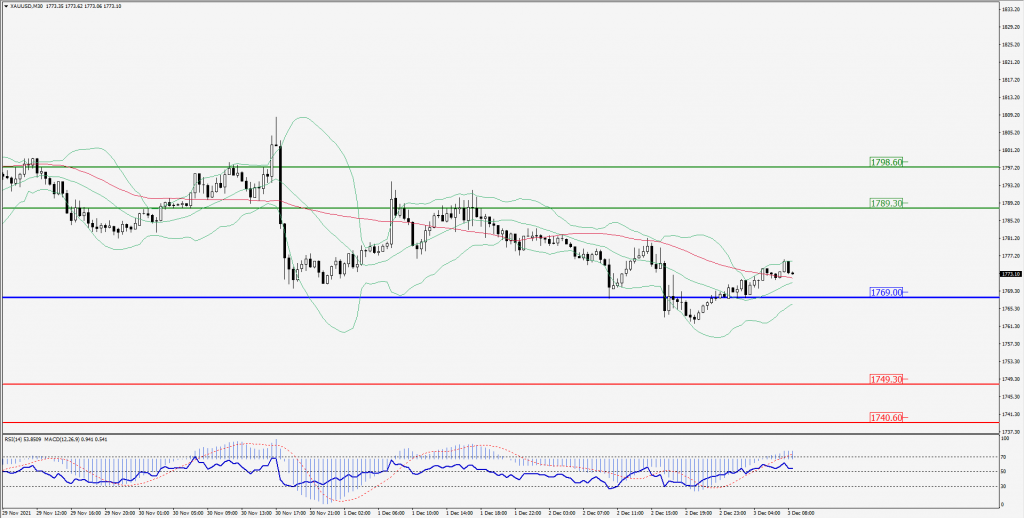
Green Lines Indicate Resistance Levels – Red Lines Indicates Support Levels
Light Blue is a Pivot Point – Black represents the price when the report was produced
Dow Jones Intraday: Trend on the upside
Our pivot point is 34,390.00
Preferable Price Action: Take Long positions above pivot with targets at 34,960.00 & 35,190.00.
Alternative Price Action: Below 34,390.00 looks for further Downside to 33,890.00 & 33,660.00.
Comment: Price above its 55MA & 20MA and RSI above 50 levels.
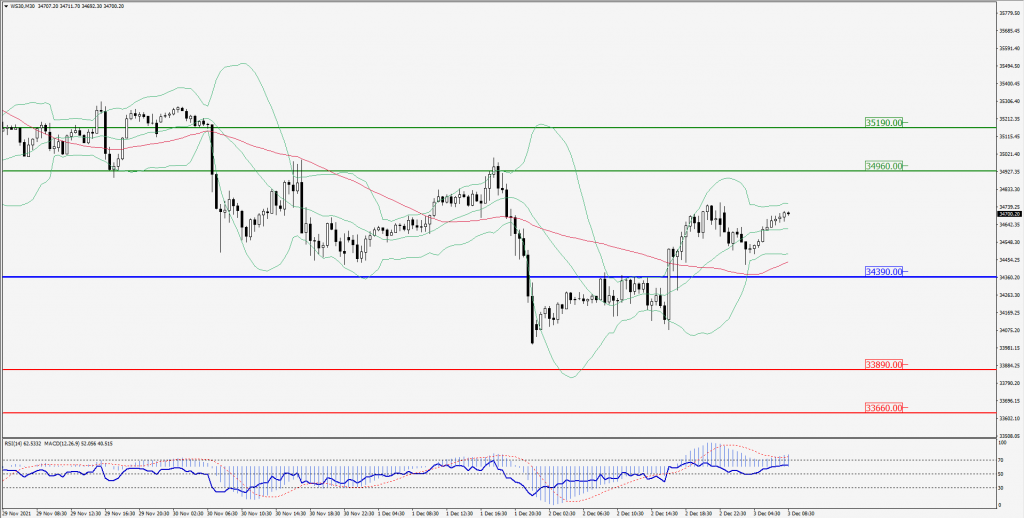
Green Lines Indicate Resistance Levels – Red Lines Indicates Support Levels
Light Blue is a Pivot Point – Black represents the price when the report was produced