Market Wrap: Stocks, Bonds, Commodities
The S&P 500 ended a five-session streak of record highs on Friday, with Intel (INTC.O), opens new tab slumping after a bleak revenue forecast, while U.S. economic data showed inflation moderating.
The Dow Jones Industrial Average rose 60.30 points to 38,109.43, the S&P 500 lose 0.07% to 4,890.97 and the Nasdaq Composite subtract 0.36 points to 15,455.36.
MSCI’s index of Asia-Pacific stocks outside Japan is advance 0.81% to 617.82 levels. The Australian index was higher by 0.30% to 7,5778.40. Japanese Nikkei Index asceend 0.84% today.
European stocks were mixed on Friday, with the Stoxx Europe 50 Index fell 0.15% to 4,629.45, Germany’s DAX drop 0.50% to 16,876.68, and France’s CAC decline 0.04% to 7,630.73 and U.K.’s FTSE 100 add 0.15% to 7,646.49.
Benchmark 10-year U.S. Treasury fell as deman for safe assets ascend again, today 10-year bond yields negative 1.30% to 4.1090.
Oil prices jumped 1 percent on Tuesday on fuel supply concerns after a missile struck a Trafigura-operated fuel tanker in the Red Sea and as Russian refined products exports are set to fall as several refineries are under repair after drone attacks.
Spot Brent crude oil drop 0.20% to $82.77 per barrel. US West Texas Intermediate crude is down 0.23% to $77.83 a barrel.
The yellow metal gold is advance 0.62% to 2,048.65 dollars per ounce.
Market Wrap: Forex
The U.S. dollar inched lower on Friday, after data showed inflation rose modestly in December but was trending lower, which should keep the Federal Reserve on track to cut interest rates by the middle of the year.
Today, the U.S. dollar index measures the Greenback against a trade-weighted basket of six major currencies, which surged 0.11% to 103.350.
The Euro US Dollar (EUR/USD) is a widely traded pair that is down 0.19% today. This left the pair trading around $1.08320.
The Japanese yen was negative against the U.S. dollar on Friday. Today USD/JPY is slipped 0.26% to the 147.780 level.
Another commodity-related currency positive against the U.S dollar, AUD/USD rose 0.35% to 0.65980, and NZD/USD surged 0.43% to 0.61160 level.
EUR/USD Intraday: Trend on the downside
Our pivot point is at 1.08560
Preferable Price Action: Take sell positions below pivot level with targets at 1.08310 & 1.08180 in extension.
Alternative Price Action: Above pivot looks for a further upside to 1.08740 & 1.08860.
Comment: RSI is below 50 levels and Pairs below 20MA.
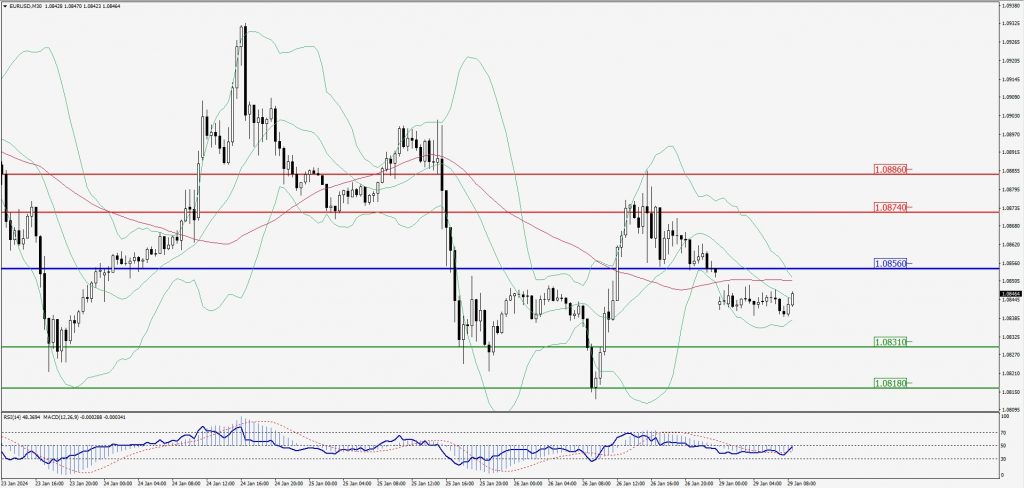
Green Lines Indicate Resistance Levels – Red Lines Indicate Support Levels
Light Blue is a Pivot Point – Black represents the price when the report was produced
GBP/USD Intraday: Support level at 1.27040
Our pivot point is at 1.27040
Preferable Price Action: Buy positions above pivot with targets at 1.27260 & 1.27410 in extension.
Alternative Price Action: The price below pivot would call for further downside to 1.26830 & 1.26700.
Comment: RSI is above 50 levels and Pairs above 20MA.
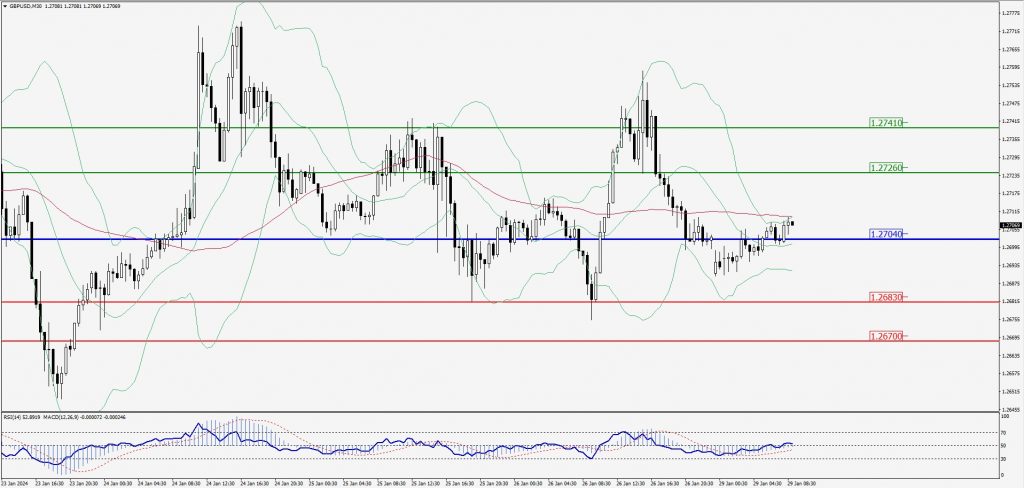
Green Lines Indicate Resistance Levels – Red Lines Indicate Support Levels
Light Blue is a Pivot Point – Black represents the price when the report was produced
USD/JPY Intraday: Trend on the downside
Our pivot point is at 147.970
Preferable Price Action: Sell position below pivot with the target at 147.590 and 147.380 in extension.
Alternative Price Action: The downside breakout of the pivot would call for 148.320 and 148.540.
Comment: MACD is below 50 level and Pairs below 55MA.
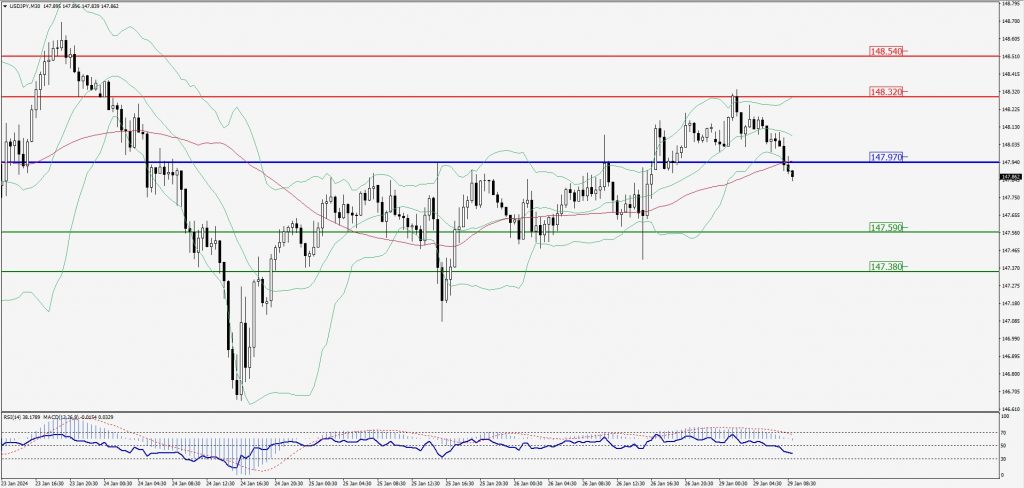
Green Lines Indicate Resistance Levels – Red Lines Indicate Support Levels
Light Blue is a Pivot Point – Black represents the price when the report was produced
AUD/USD Intraday: Support level at 0.65880
Our pivot point is at 0.65880
Preferable Price Action: Buy positions above pivot with targets at 0.66010 & 0.66100 in extension.
Alternative Price Action: Below pivot looks for a further downside with 0.65770 & 0.65690 as targets.
Comment: RSI is above 50 levels and Pairs above its 20MA & 55MA.
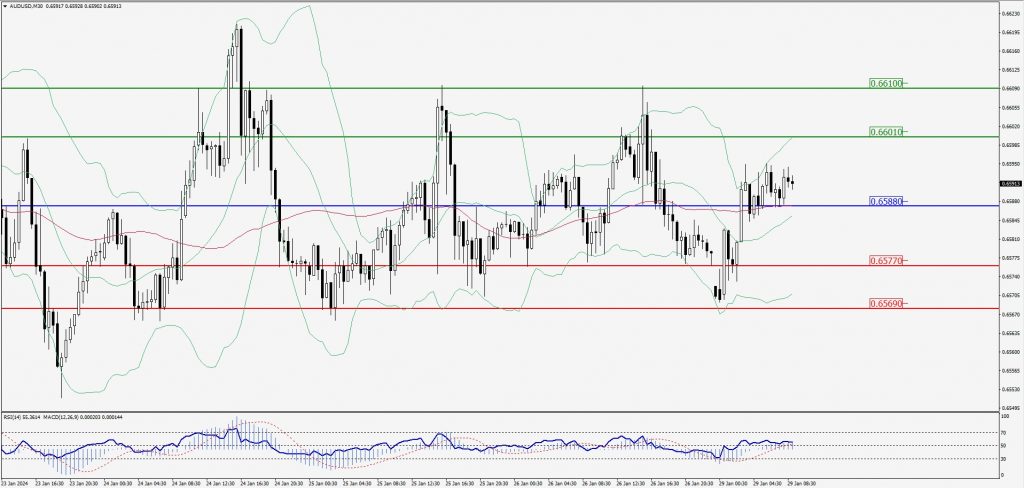
Green Lines Indicate Resistance Levels – Red Lines Indicate Support Levels
Light Blue is a Pivot Point – Black represents the price when the report was produced
CRUDEOIL Intraday: Trend on the upside
Our pivot point is at 78.00
Preferable Price Action: Above pivot buy oil with 78.73 & 79.32 as targets.
Alternative Price Action: Sell crude below pivot with targets at 77.38 and 76.92 in extension.
Comment: MACD is positive territory and Pairs above 55MA.
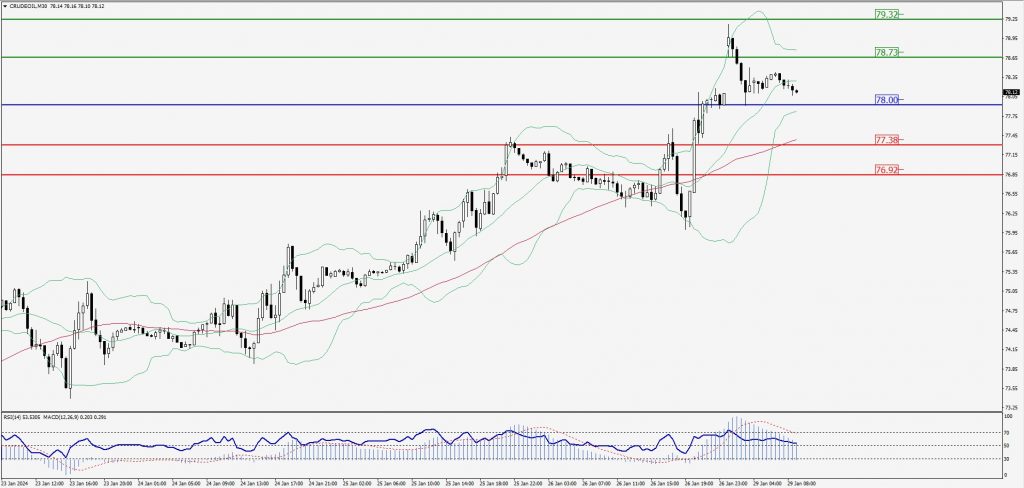
Green Lines Indicate Resistance Levels – Red Lines Indicate Support Levels
Light Blue is a Pivot Point – Black represents the price when the report was produced
XAU/USD Intraday: Major trend on the upside
Our pivot point is 2029.10
Preferable Price Action: Further upside to 2033.70 and 2036.90.
Alternative Price Action: If the price gives a downside breakout of a pivot, then the price extends to 2024.70 and 2021.60.
Comment: MACD is above 50 level and Pairs above its 20MA & 55MA.
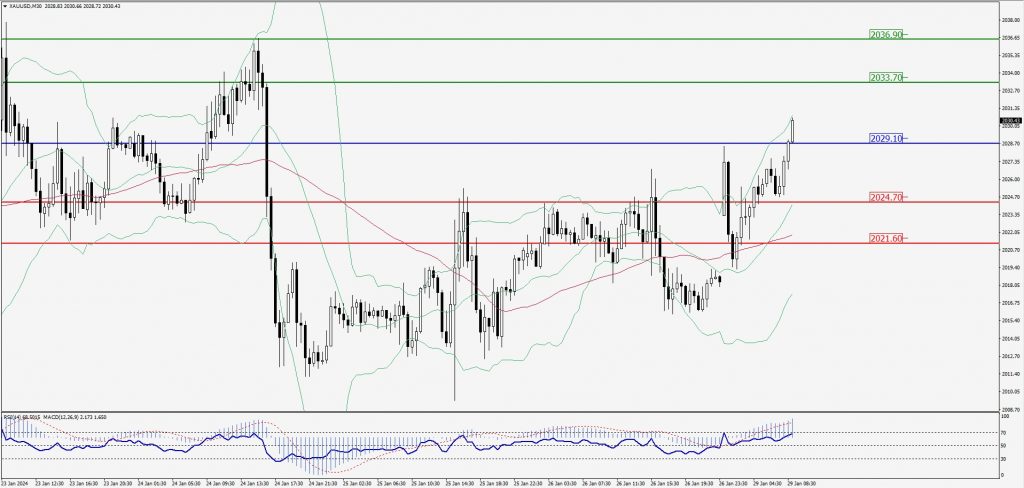
Green Lines Indicate Resistance Levels – Red Lines Indicate Support Levels
Light Blue is a Pivot Point – Black represents the price when the report was produced
Dow Jones Intraday: Trend on the upside
Our pivot point is 38,054.00
Preferable Price Action: Take buy positions above the pivot with targets at 38,154.00 & 38,211.00.
Alternative Price Action: Below 38,054.00 looks for further downside to 37,977.00 & 37,917.00.
Comment: RSI is above 50 levels and Pairs above its 20MA & 55MA.
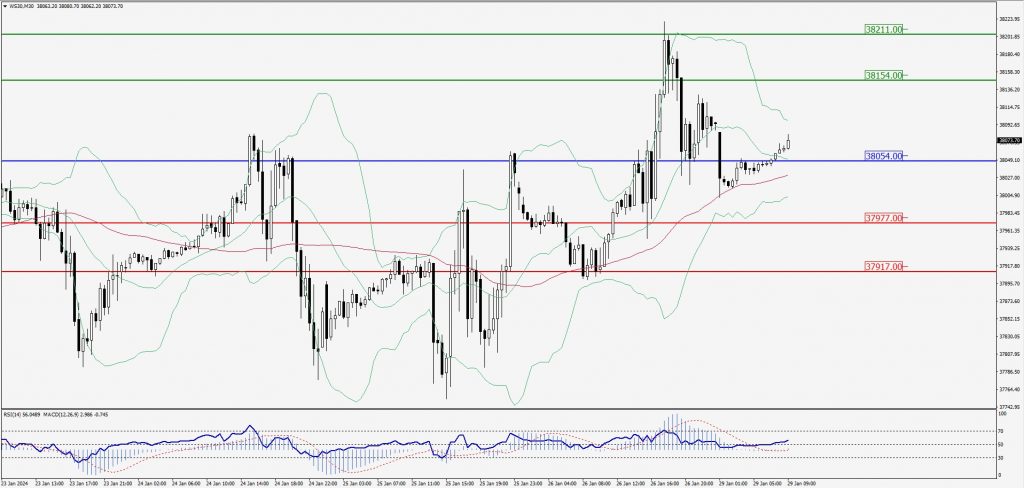
Green Lines Indicate Resistance Levels – Red Lines Indicate Support Levels
Light Blue is a Pivot Point – Black represents the price when the report was produced