Market Wrap: Stocks, Bonds, Commodities
The Dow and S&P 500 edged lower on Monday, dragged down by investor worries over the timing of interest rate cuts by the Federal Reserve after stronger-than-expected manufacturing data pushed Treasury yields higher.
The Dow Jones Industrial Average fell 240.52 points to 39,566.85, the S&P 500 lose 0.20% to 5,243.77 and the Nasdaq Composite surged 17.37 points to 16,396.83.
MSCI’s index of Asia-Pacific stocks outside Japan is advance 1.08% to 659.67 levels. The Australian index was lower by 0.11% to 7,887.90. Japanese Nikkei Index ascend 0.06% today.
European stocks were mixed on Tuesday, with the Stoxx Europe 50 Index fell 0.10% to 5,100.95, Germany’s DAX drop 0.12% to 18,481.05, and France’s CAC advance 0.09% to 8,211.59 and U.K.’s FTSE 100 add 0.35% to 7,980.18.
Benchmark 10-year U.S. Treasury rose as demand for safe assets drop again, today 10-year bond yields negative 0.23% to 4.3180.
Crude prices edged up about 1 percent to a five-month high on Monday on expectations oil demand will climb following the release of positive economic news from the US and China, while OPEC+ cuts and attacks on Russian refineries tighten global supplies.
Spot Brent crude oil ascend 1.58% to $88.80 per barrel. US West Texas Intermediate crude is up 1.71% to $85.14 a barrel.
The yellow metal gold is advance 1.06% to 2,280.95 dollars per ounce.
Market Wrap: Forex
The U.S. dollar hovered near a 4-1/2-month peak against major peers on Tuesday as traders rushed to push back bets for the Federal Reserve’s first interest rate cut this year.
Today, the U.S. dollar index measures the Greenback against a trade-weighted basket of six major currencies, which slipped 0.02% to 104.760.
The Euro US Dollar (EUR/USD) is a widely traded pair that is down 0.10% today. This left the pair trading around $1.07320.
The Japanese yen was negative against the U.S. dollar on Tuesday. Today USD/JPY is slipped 0.02% to the 151.590 level.
Another commodity-related currency positive against the U.S dollar, AUD/USD rose 0.29% to 0.65070, and NZD/USD surged 0.08% to 0.59560 level.
EUR/USD Intraday: Trend on the downside
Our pivot point is at 1.07420
Preferable Price Action: Take sell positions below pivot level with targets at 1.07210 & 1.07070 in extension.
Alternative Price Action: Above pivot looks for a further upside to 1.07620 & 1.07780.
Comment: RSI is below 50 levels and pairs below its 20MA & 55MA.
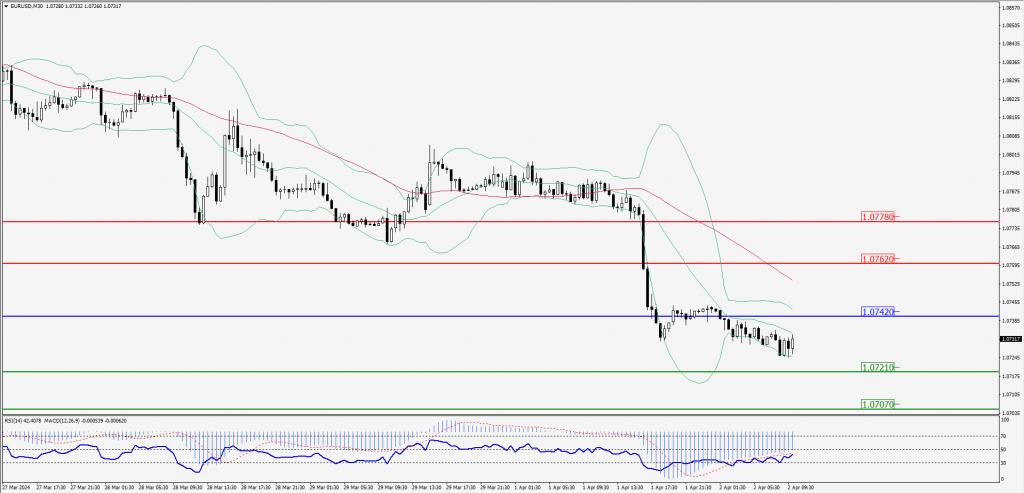
Green Lines Indicate Resistance Levels – Red Lines Indicate Support Levels
Light Blue is a Pivot Point – Black represents the price when the report was produced
GBP/USD Intraday: Trend on the upside
Our pivot point is at 1.25510
Preferable Price Action: Buy positions above pivot with targets at 1.25690 & 1.25840 in extension.
Alternative Price Action: The price below pivot would call for further downside to 1.25330 & 1.25200.
Comment: RSI is above 50 levels and pairs above 20MA.

Green Lines Indicate Resistance Levels – Red Lines Indicate Support Levels
Light Blue is a Pivot Point – Black represents the price when the report was produced
USD/JPY Intraday: Trend on the upside
Our pivot point is at 151.690
Preferable Price Action: Buy position above pivot with the target at 151.840 and 151.930 in extension.
Alternative Price Action: The downside breakout of the pivot would call for 151.550 and 151.450.
Comment: MACD is above 50 levels and Pairs above 55MA.

Green Lines Indicate Resistance Levels – Red Lines Indicate Support Levels
Light Blue is a Pivot Point – Black represents the price when the report was produced
AUD/USD Intraday: Trend on the upside
Our pivot point is at 0.64890
Preferable Price Action: Buy positions above pivot with targets at 0.64980 & 0.65060 in extension.
Alternative Price Action: Below pivot looks for a further downside with 0.64800 & 0.64720 as targets.
Comment: RSI is at 50 levels.

Green Lines Indicate Resistance Levels – Red Lines Indicate Support Levels
Light Blue is a Pivot Point – Black represents the price when the report was produced
CRUDEOIL Intraday: Trend on the upside
Our pivot point is at 83.69
Preferable Price Action: Above pivot buy oil with 84.41 & 84.91 as targets.
Alternative Price Action: Sell crude below pivot with targets at 82.95 and 82.36 in extension.
Comment: MACD is positive territory and Pairs above its 20MA & 55MA.

Green Lines Indicate Resistance Levels – Red Lines Indicate Support Levels
Light Blue is a Pivot Point – Black represents the price when the report was produced
XAU/USD Intraday: Trend on the upside
Our pivot point is 2251.70
Preferable Price Action: Further upside to 2267.10 and 2278.60.
Alternative Price Action: If the price gives an downside breakout of a pivot, then the price extends to 2235.70 and 2223.60.
Comment: MACD is above 50 levels and pairs above its 20MA & 55MA.

Green Lines Indicate Resistance Levels – Red Lines Indicate Support Levels
Light Blue is a Pivot Point – Black represents the price when the report was produced
Dow Jones Intraday: Trend on the downside
Our pivot point is 39,474.10
Preferable Price Action: Take sell positions below the pivot with targets at 39,373.40 & 39,295.80.
Alternative Price Action: Above 39,474.10 looks for further upside to 39,570.90 & 39,640.90.
Comment: RSI is below 50 levels and Pairs below 55MA.
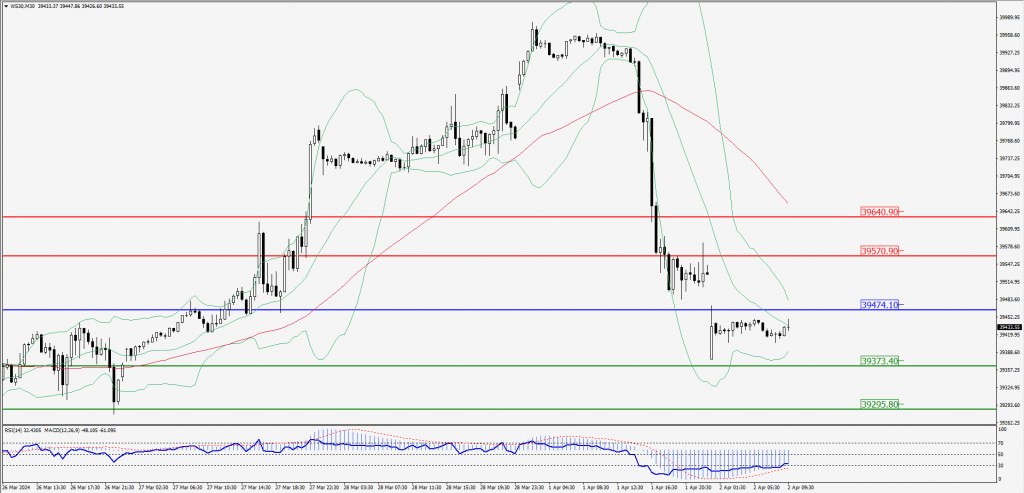
Green Lines Indicate Resistance Levels – Red Lines Indicate Support Levels
Light Blue is a Pivot Point – Black represents the price when the report was produced