Market Wrap: Stocks, Bonds, Commodities
The S&P 500 closed out the week with slight gains on Thursday, with the benchmark index notching its strongest first quarter in five years, as investors digested the latest batch of economic data while looking towards the next inflation reading.
The Dow Jones Industrial Average rose 47.29 points to 39,807.37, the S&P 500 gain 0.11% to 5,254.35 and the Nasdaq Composite slipped 20.06 points to 16,379.46.
MSCI’s index of Asia-Pacific stocks outside Japan is advance 0.04% to 654.90 levels. The Australian index was higher by 0.99% to 7,896.90. Japanese Nikkei Index drop 1.31% today.
European stocks were positive on Monday , with the Stoxx Europe 50 Index rose 0.02% to 5,082.85, Germany’s DAX ascend 0.15% to 18,504.51, and France’s CAC advance 0.01% to 8,205.81 and U.K.’s FTSE 100 add 0.26% to 7,952.62.
Benchmark 10-year U.S. Treasury rose as demand for safe assets drop again, today 10-year bond yields positive 0.26% to 4.2050.
Oil prices rose on Monday, adding to recent gains amid expectations of tighter supply from OPEC+ cuts, attacks on Russian refineries and as upbeat Chinese manufacturing data supported outlooks for improving demand.
Spot Brent crude oil drop 0.15% to $86.87 per barrel. US West Texas Intermediate crude is down 0.13% to $83.06 a barrel.
The yellow metal gold is advance 1.48% to 2,271.95 dollars per ounce.
Market Wrap: Forex
The dollar was broadly steady on Monday as data showing easing U.S. prices bolstered bets that the Federal Reserve could cut interest rates in June, while the yen loitered near 152 per dollar keeping traders on edge on the threat of intervention.
Today, the U.S. dollar index measures the Greenback against a trade-weighted basket of six major currencies, which surged 0.02% to 104.285.
The Euro US Dollar (EUR/USD) is a widely traded pair that is down 0.06% today. This left the pair trading around $1.07840.
The Japanese yen was positive against the U.S. dollar on Monday . Today USD/JPY is surged 0.03% to the 151.390 level.
Another commodity-related currency positive against the U.S dollar, AUD/USD rose 0.01% to 0.65220, and NZD/USD surged 0.04% to 0.59790 level.
EUR/USD Intraday: Trend on the downside
Our pivot point is at 1.07920
Preferable Price Action: Take sell positions below pivot level with targets at 1.07780 & 1.07680 in extension.
Alternative Price Action: Above pivot looks for a further upside to 1.08050 & 1.08170.
Comment: RSI is at 50 levels.

Green Lines Indicate Resistance Levels – Red Lines Indicate Support Levels
Light Blue is a Pivot Point – Black represents the price when the report was produced
GBP/USD Intraday: Trend on the downside
Our pivot point is at 1.26310
Preferable Price Action: Sell positions below pivot with targets at 1.26190 & 1.26090 in extension.
Alternative Price Action: The price above pivot would call for further upside to 1.26430 & 1.26530.
Comment: RSI is below 50 levels and pairs below 55MA.

Green Lines Indicate Resistance Levels – Red Lines Indicate Support Levels
Light Blue is a Pivot Point – Black represents the price when the report was produced
USD/JPY Intraday: Support level at 151.340
Our pivot point is at 151.340
Preferable Price Action: Buy position above pivot with the target at 151.480 and 151.600 in extension.
Alternative Price Action: The downside breakout of the pivot would call for 151.210 and 151.090.
Comment: MACD is above 50 levels and Pairs above its 20MA & 55MA.

Green Lines Indicate Resistance Levels – Red Lines Indicate Support Levels
Light Blue is a Pivot Point – Black represents the price when the report was produced
AUD/USD Intraday: Trend on the upside
Our pivot point is at 0.65240
Preferable Price Action: Buy positions above pivot with targets at 0.65340 & 0.65420 in extension.
Alternative Price Action: Below pivot looks for a further downside with 0.65130 & 0.65050 as targets.
Comment: RSI is above 50 levels and pairs above 55MA.

Green Lines Indicate Resistance Levels – Red Lines Indicate Support Levels
Light Blue is a Pivot Point – Black represents the price when the report was produced
CRUDEOIL Intraday: Trend on the upside
Our pivot point is at 83.31
Preferable Price Action: Above pivot buy oil with 83.79 & 84.21 as targets.
Alternative Price Action: Sell crude below pivot with targets at 82.81 and 82.37 in extension.
Comment: MACD is positive territory and Pairs above its 20MA & 55MA.

Green Lines Indicate Resistance Levels – Red Lines Indicate Support Levels
Light Blue is a Pivot Point – Black represents the price when the report was produced
XAU/USD Intraday: Trend on the upside
Our pivot point is 2253.10
Preferable Price Action: Further upside to 2267.50 and 2279.00.
Alternative Price Action: If the price gives an downside breakout of a pivot, then the price extends to 2238.40 and 2225.70.
Comment: MACD is above 50 levels and pairs above its 20MA & 55MA.

Green Lines Indicate Resistance Levels – Red Lines Indicate Support Levels
Light Blue is a Pivot Point – Black represents the price when the report was produced
Dow Jones Intraday: Trend on the upside
Our pivot point is 39,916.40
Preferable Price Action: Take buy positions above the pivot with targets at 40,005.30 & 40,076.60.
Alternative Price Action: Below 39,916.40 looks for further downside to 39,819.30 & 39,733.90.
Comment: RSI is above 50 levels and Pairs above 55MA.
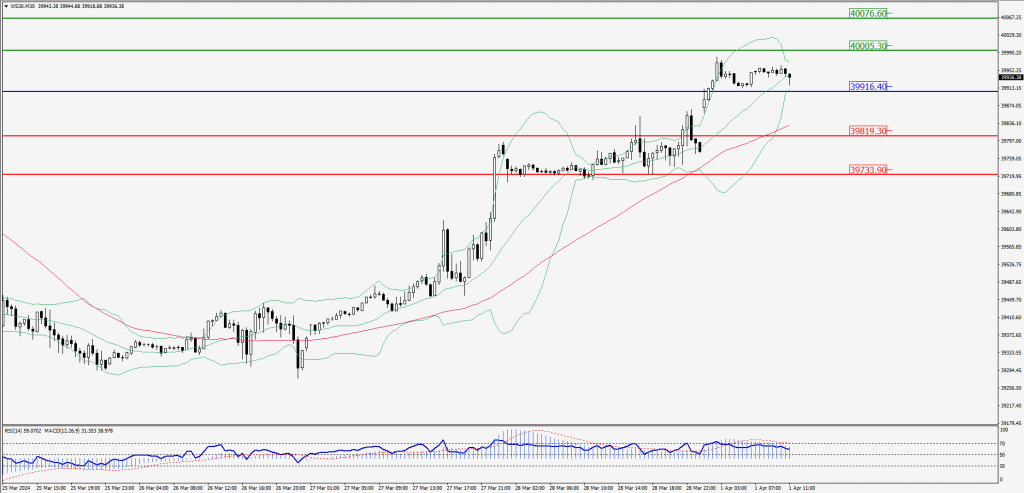
Green Lines Indicate Resistance Levels – Red Lines Indicate Support Levels
Light Blue is a Pivot Point – Black represents the price when the report was produced