Market Wrap: Stocks, Bonds, Commodities
Stock futures were slightly lower Tuesday evening as Wall Street geared up for the Federal Reserve’s latest policy decision on interest rates after closing out a terrible month.
The Dow Jones Industrial Average rose 123.91 points to 32,928.96, the S&P 500 gain 0.65% to 4,193.80 and the Nasdaq Composite add 61.76 points to 12,851.24.
MSCI’s index of Asia-Pacific stocks outside Japan is decline 0.10% to 580.32 levels. The Australian index was higher by 0.85% to 6,838.30. Japanese Nikkei Index ascend 2.36% today.
European stocks were positive on Wednesday, with the Stoxx Europe 50 Index rose 0.15% to 4,067.05, Germany’s DAX ascend 0.19% to 14,840.45, and France’s CAC advance 0.24% to 6,901.91 and U.K.’s FTSE 100 add 0.16% to 7,333.14.
Benchmark 10-year U.S. Treasury fell as demand for safe assets ascend again, today 10-year bond yields positive 0.55% to 4.9040.
Oil prices edged higher on Tuesday as a drop in euro zone inflation buoyed hopes that the European Central Bank has almost certainly finished raising interest rates and offset rising supply from OPEC and the United States.
Spot Brent crude oil ascend 0.89% to $85.80 per barrel. US West Texas Intermediate crude is up 0.91% to $81.75 a barrel.
The yellow metal gold is decline 0.10% to 1,992.15 dollars per ounce.
Market Wrap: Forex
The U.S. dollar edged higher in early European trade Wednesday ahead of the conclusion of the latest Federal Reserve meeting, while the yen remained near its one-year low.
Today, the U.S. dollar index measures the Greenback against a trade-weighted basket of six major currencies, which surged 0.12% to 106.620.
The Euro US Dollar (EUR/USD) is a widely traded pair that is down 0.16% today. This left the pair trading around $1.05600.
The Japanese yen was negative against the U.S. dollar on Wednesday. Today USD/JPY is slipped 0.29% to the 151.220 level.
Another commodity-related currency mixed against the U.S dollar, AUD/USD rose 0.14% to 0.63450, and NZD/USD slipped 0.05% to 0.58220 level.
EUR/USD Intraday: Trend on the downside
Our pivot point is at 1.05870
Preferable Price Action: Take sell positions below pivot level with targets at 1.05570 & 1.05400 in extension.
Alternative Price Action: Above pivot looks for a further upside to 1.06100 & 1.06270.
Comment: RSI is below 50 levels and Pairs below 55MA.
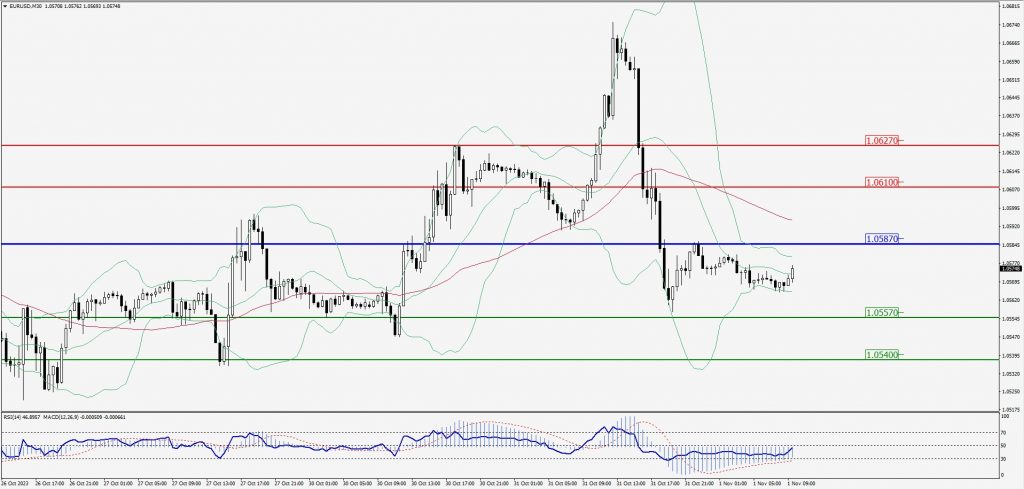
Green Lines Indicate Resistance Levels – Red Lines Indicate Support Levels
Light Blue is a Pivot Point – Black represents the price when the report was produced
GBP/USD Intraday: Support level at 1.21380
Our pivot point is at 1.21380
Preferable Price Action: Buy positions above pivot with targets at 1.21620 & 1.21790 in extension.
Alternative Price Action: The price below pivot would call for further downside to 1.21170 & 1.21020.
Comment: RSI is above 50 levels and Pairs above 20MA.
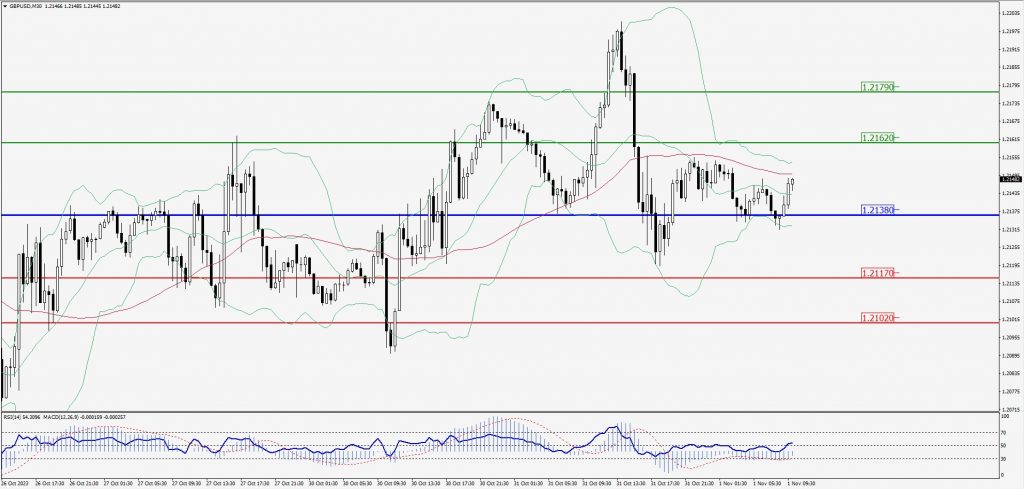
Green Lines Indicate Resistance Levels – Red Lines Indicate Support Levels
Light Blue is a Pivot Point – Black represents the price when the report was produced
USD/JPY Intraday: Trend on the downside
Our pivot point is at 151.400
Preferable Price Action: Sell position below pivot with the target at 150.720 and 150.270 in extension.
Alternative Price Action: The upside breakout of the pivot would call for 152.060 and 152.520.
Comment: MACD is below 50 level and Pairs below 20MA.
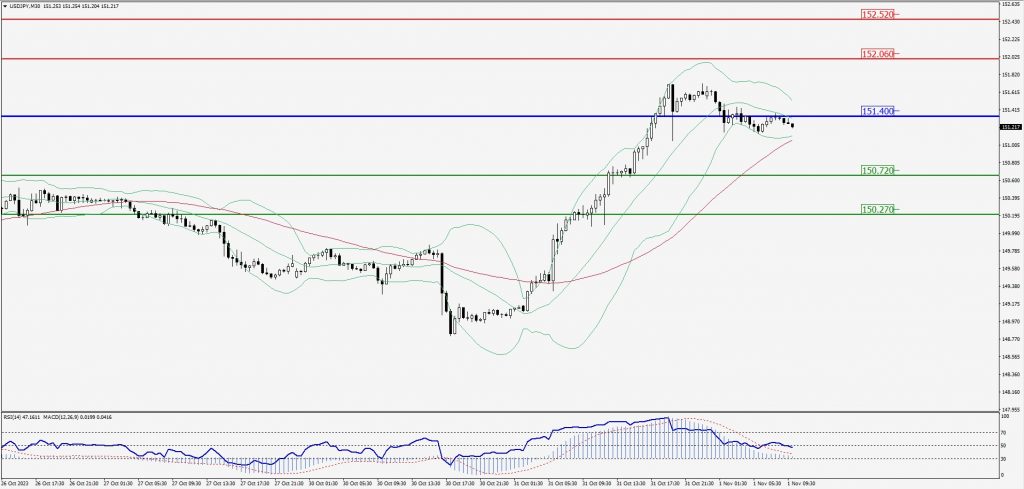
Green Lines Indicate Resistance Levels – Red Lines Indicate Support Levels
Light Blue is a Pivot Point – Black represents the price when the report was produced
AUD/USD Intraday: Trend on the upside
Our pivot point is at 0.63370
Preferable Price Action: Buy positions above pivot with targets at 0.63550 & 0.63660 in extension.
Alternative Price Action: Below pivot looks for a further downside with 0.63230 & 0.63130 as targets.
Comment: RSI is above 50 levels and Pairs above 20MA.
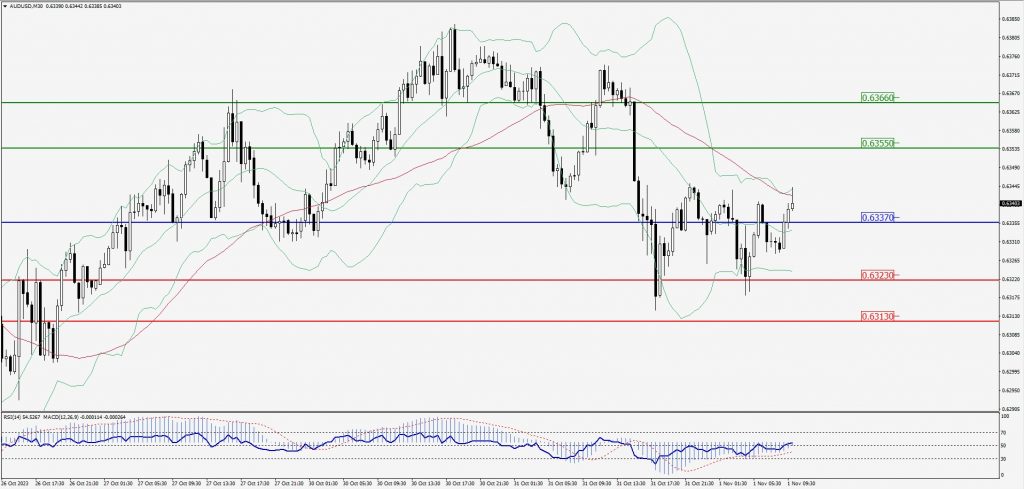
Green Lines Indicate Resistance Levels – Red Lines Indicate Support Levels
Light Blue is a Pivot Point – Black represents the price when the report was produced
CRUDEOIL Intraday: Trend on the upside
Our pivot point is at 80.93
Preferable Price Action: Above pivot buy oil with 81.89 & 82.50 as targets.
Alternative Price Action: Sell crude below pivot with targets at 79.97 and 79.36 in extension.
Comment: MACD is flat territory.
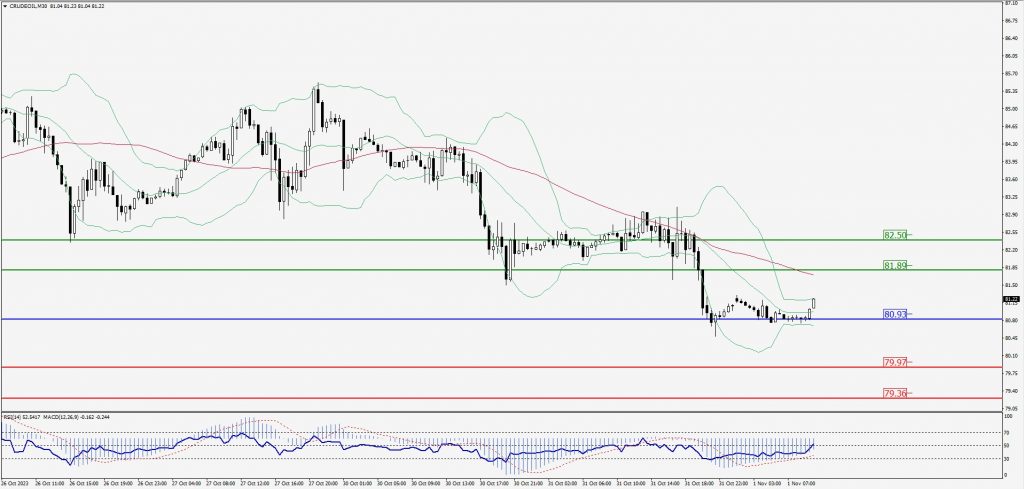
Green Lines Indicate Resistance Levels – Red Lines Indicate Support Levels
Light Blue is a Pivot Point – Black represents the price when the report was produced
XAU/USD Intraday: Trend on the downside
Our pivot point is 1982.70
Preferable Price Action: Further downside to 1974.90 and 1970.40.
Alternative Price Action: If the price gives an upside breakout of a pivot, then the price extends to 1988.50 and 1993.30.
Comment: MACD is below 50 level and Pairs below 55MA.
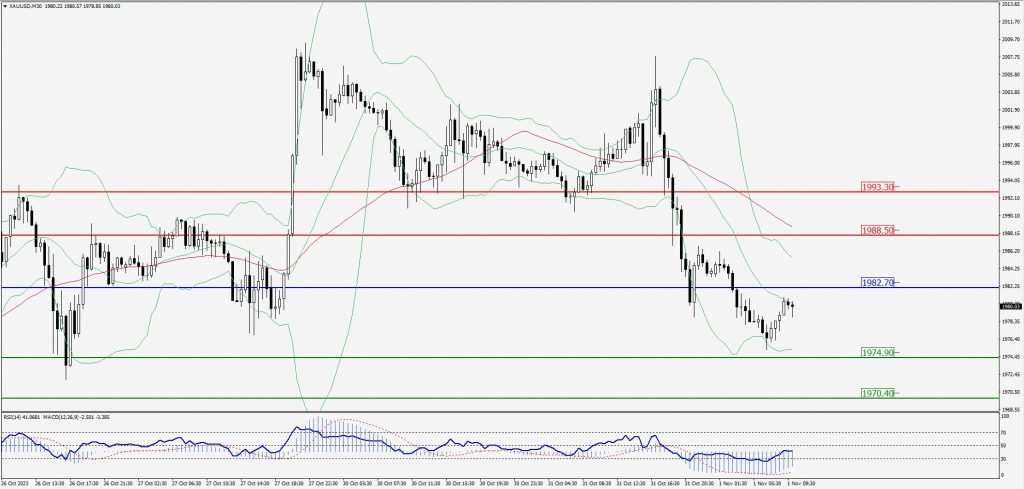
Green Lines Indicate Resistance Levels – Red Lines Indicate Support Levels
Light Blue is a Pivot Point – Black represents the price when the report was produced
Dow Jones Intraday: Trend on the upside
Our pivot point is 32,969.00
Preferable Price Action: Take buy positions above the pivot with targets at 33,148.00 & 33,266.00.
Alternative Price Action: Below 32,969.00 looks for further downside to 32,807.00 & 32,696.00.
Comment: RSI is above 50 levels and Pairs above its 20MA & 55MA.
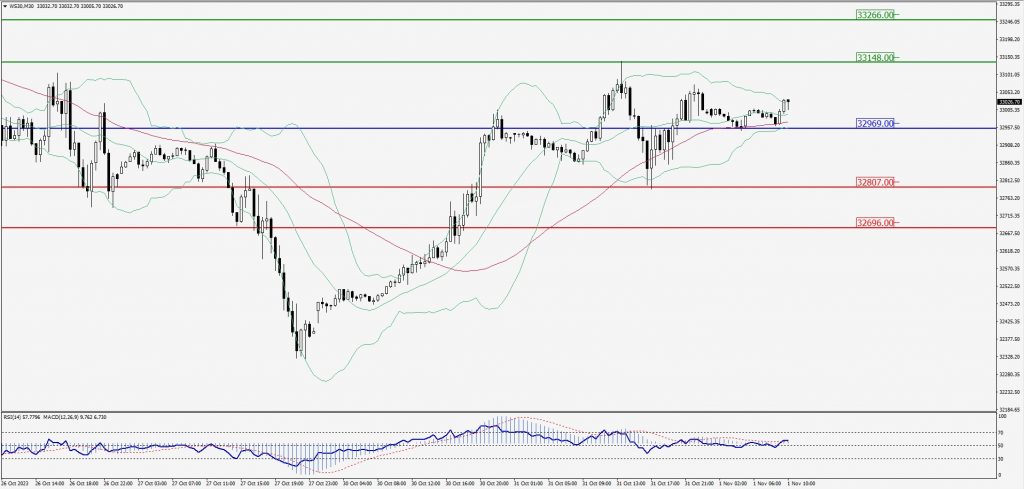
Green Lines Indicate Resistance Levels – Red Lines Indicate Support Levels
Light Blue is a Pivot Point – Black represents the price when the report was produced