Market Wrap: Stocks, Bonds, Commodities
Wall Street indices and global equities slid further on Tuesday, and bonds wrapped up a difficult month by holding their elevated yields, as more evidence of stubborn inflation added to expectations that central banks will keep rates high.
The Dow Jones Industrial Average fell 232.39 points to 32,656.70, the S&P 500 lose 0.30% to 3,970.15 and the Nasdaq Composite subtract 11.44 points to 11,455.54
MSCI’s index of Asia-Pacific stocks outside Japan is advance 2.20% to 637.71 levels. The Australian index was lower by 0.09% to 7,251.60. Japanese Nikkei Index rose 0.26% today.
European stocks were negative on Wednesday, with the Stoxx Europe 50 Index lose 0.23% to 4,238.38, Germany’s DAX fell 0.11% to 15,365.14, and France’s CAC decline 0.38% to 7,267.93, and U.K.’s FTSE 100 subtract 0.74% to 7,876.28.
Benchmark 10-year U.S. Treasury fell as demand for safe assets ascend again, today 10-year bond yields are positive 1.15% to 3.9590.
Oil prices rose nearly 2 percent on Tuesday, erasing the previous session’s losses, as hopes for a strong economic rebound in China offset worries about US interest rate hikes dragging down consumption in the world’s biggest economy.
Spot Brent crude oil rose 0.66% to $84.00 per barrel. US West Texas Intermediate crude is up 0.66% to $77.56 a barrel.
The yellow metal gold is advance 0.23% to 1,840.85 dollars per ounce.
Market Wrap: Forex
European stock markets are expected to open higher Wednesday, helped by signs of recovery in China’s important manufacturing base ahead of an economic data deluge.
Today, the U.S. dollar index measures the Greenback against a trade-weighted basket of six major currencies, which slipped 0.24% to 104.575.
The Euro US Dollar (EUR/USD) is a widely traded pair that is up 0.43% today. This left the pair trading around $1.06220.
The Japanese yen was positive against the U.S. dollar on Wednesday. Today USD/JPY is advance 0.04% to the 136.260 level.
Another commodity-related currency positive against the U.S dollar, AUD/USD gain 0.50% to 0.67620, and NZD/USD rose 0.86% to 0.62350 level.
EUR/USD Intraday: Support level at 1.06030
Our pivot point is at 1.06030
Preferable Price Action: Take long positions above pivot level with targets at 1.06260 & 1.06410 in extension.
Alternative Price Action: Below pivot looks for a further downside to 1.05790 & 1.05630.
Comment: RSI is above 50 levels and Pairs above its 20MA & 55MA.
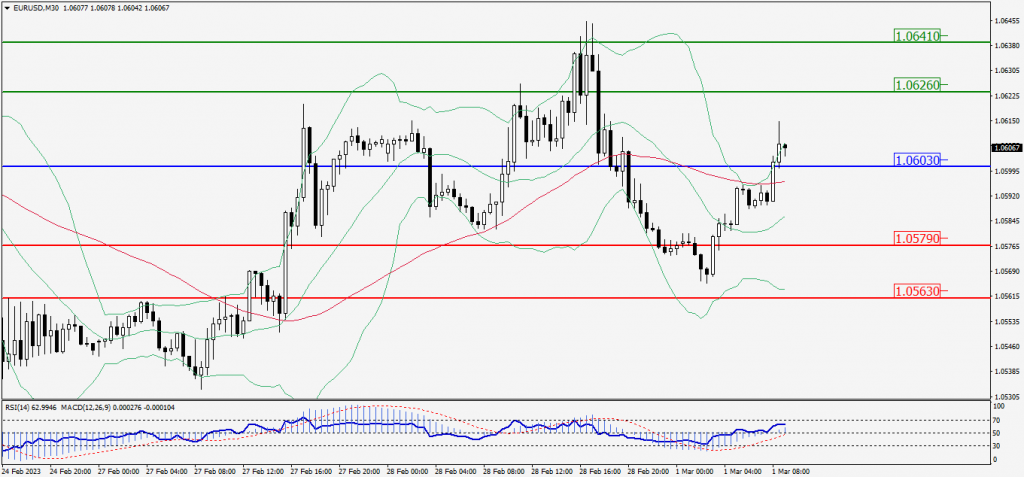
Green Lines Indicate Resistance Levels – Red Lines Indicate Support Levels
Light Blue is a Pivot Point – Black represents the price when the report was produced
GBP/USD Intraday: Support level at 1.20500
Our pivot point is at 1.20500
Preferable Price Action: Buy positions above pivot with targets at 1.20920 & 1.21230 in extension.
Alternative Price Action: The price below pivot would call for further downside to 1.20080 & 1.19780.
Comment: RSI is above 50 levels and Pairs above 20MA.
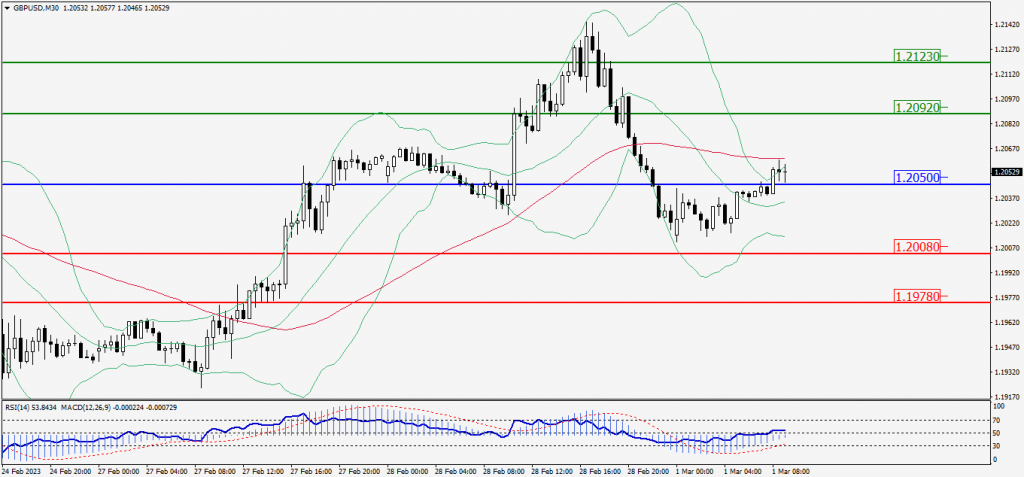
Green Lines Indicate Resistance Levels – Red Lines Indicate Support Levels
Light Blue is a Pivot Point – Black represents the price when the report was produced
USD/JPY Intraday: Resistance level at 136.250
Our pivot point is at 136.350
Preferable Price Action: Sell position below pivot with the target at 136.120 and 135.940 in extension.
Alternative Price Action: The upside breakout of the pivot would call for 136.570 and 136.740.
Comment: MACD is below 50 level and Pairs below 55MA.
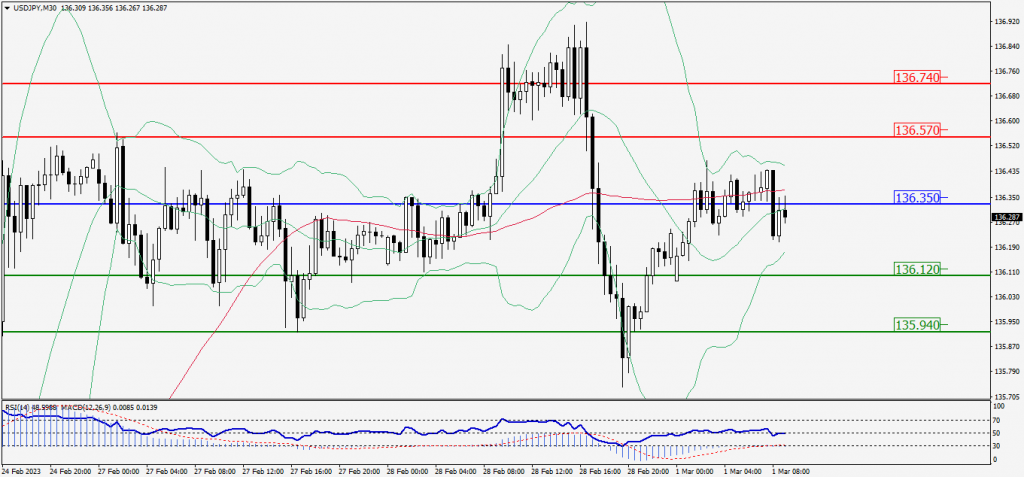
Green Lines Indicate Resistance Levels – Red Lines Indicate Support Levels
Light Blue is a Pivot Point – Black represents the price when the report was produced
AUD/USD Intraday: Trend on the upside
Our pivot point is at 0.67550
Preferable Price Action: Buy positions above pivot with targets at 0.67790 & 0.67980 in extension.
Alternative Price Action: Below pivot looks for a further downside with 0.67320 & 0.67140 as targets.
Comment: RSI is above 50 levels and pairs above its 20MA & 55MA.
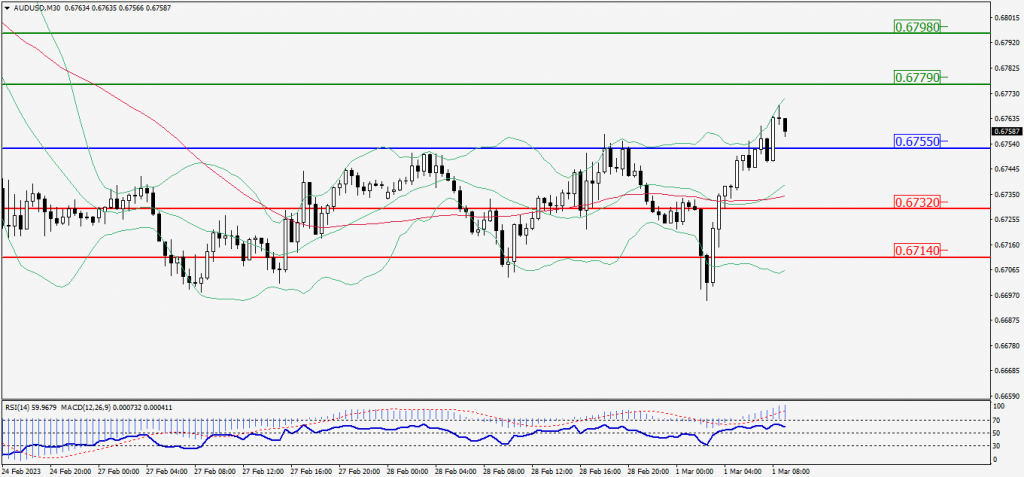
Green Lines Indicate Resistance Levels – Red Lines Indicate Support Levels
Light Blue is a Pivot Point – Black represents the price when the report was produced
CRUDEOIL Intraday: Trend on the upside
Our pivot point is at 77.40
Preferable Price Action: Above pivot buy oil with 78.51 & 79.31 as targets.
Alternative Price Action: Sell crude below pivot with targets at 76.25 and 75.50 in extension.
Comment: MACD is positive territory and Pairs above its 20MA & 55MA.
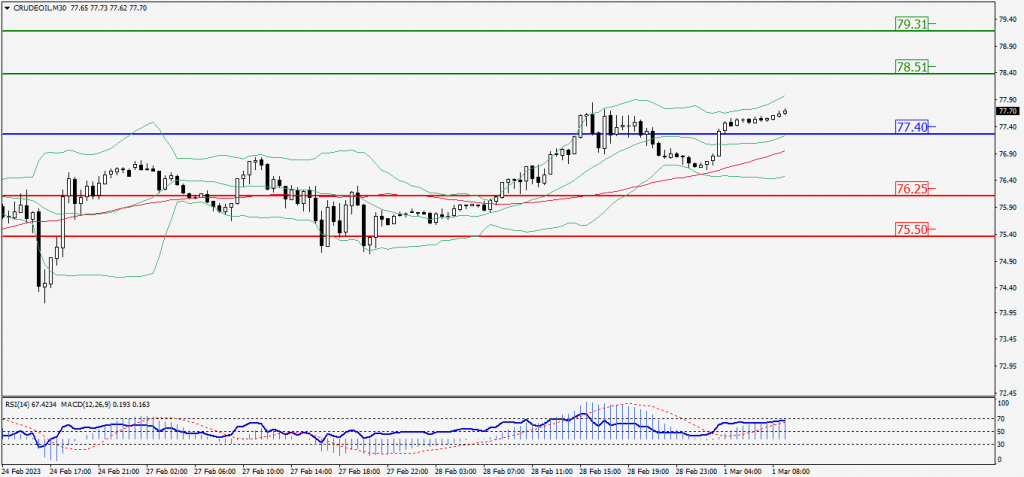
Green Lines Indicate Resistance Levels – Red Lines Indicate Support Levels
Light Blue is a Pivot Point – Black represents the price when the report was produced
XAU/USD Intraday: Major trend on the upside
Our pivot point is 1832.50
Preferable Price Action: Further upside to 1842.70 and 1850.50
Alternative Price Action: If the price gives a downside breakout of a pivot, then the price extends to 1823.10 and 1815.50.
Comment: MACD is above 50 level and Pairs above its 20MA & 55MA.
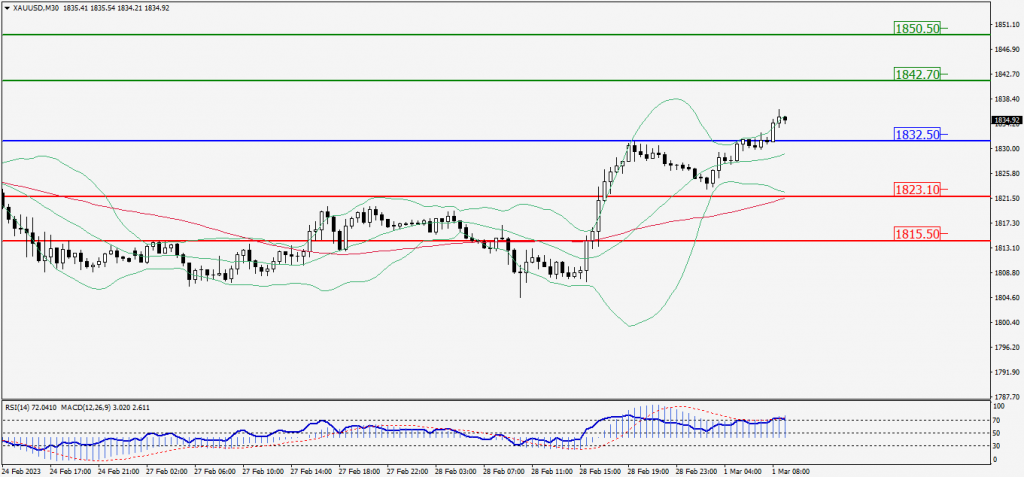
Green Lines Indicate Resistance Levels – Red Lines Indicate Support Levels
Light Blue is a Pivot Point – Black represents the price when the report was produced
Dow Jones Intraday: In a consolidation zone
Our pivot point is 32,670.00
Preferable Price Action: Take buy positions above the pivot with targets at 32,840.00 & 32,972.00.
Alternative Price Action: Below 32,670.00 looks for further downside to 32,507.00 & 32,386.00.
Comment: RSI is at 50 levels and Pairs above 20MA.
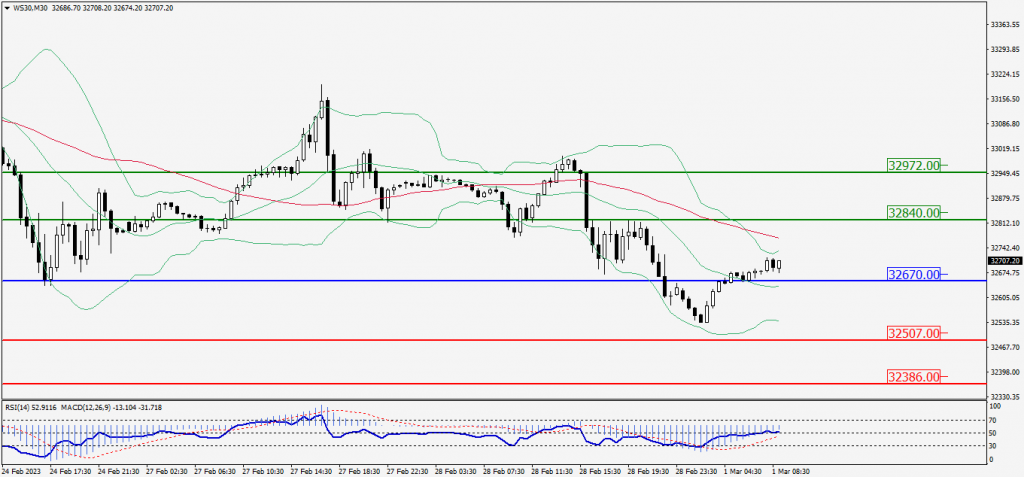
Green Lines Indicate Resistance Levels – Red Lines Indicate Support Levels
Light Blue is a Pivot Point – Black represents the price when the report was produced