Market Wrap: Stocks, Bonds, Commodities
Asian stocks regained some composure on Tuesday as the massive selling that rocked financial markets after Russia’s invasion of Ukraine last week paused for breath while surging crude prices supported oil exporters in the region.
The S&P 500 Lost (0.25%) ended at 4,373.79 points, while the Nasdaq Composite rose 0.41% to 13,751.40. The Dow Jones Industrial was down 0.49% to 33,892.60.
MSCI’s index of Asia-Pacific stocks outside Japan is gained 0.64% to 751.04 levels. Australian index Surged 0.67% to 7,096.50. Japanese Nikkei Index collects 1.20% to 26,844.72.
European stocks were mixed on Tuesday, with the Stoxx Europe 50 Index lost 0.29% to 3.912.75 Germany’s DAX loos 0.37% to 14,407.32, and France’s CAC pulled down 0.17% to 6,647.63, and U.K.’s FTSE 100 gain 0.04% to 7,461.21.
Benchmark 10-year U.S. Treasury fell as demand for safe assets gain again, today 10-year bond yields a positive 1.856.
Oil prices surged on Tuesday as concerns over potential supply disruptions amid Russia’s invasion of Ukraine outweighed talk of a coordinated global release of crude stocks to calm markets.
Spot Brent crude oil rose 1.87% to $99.80 per barrel. US West Texas Intermediate crude up 1.60% to $97.25 a barrel.
The yellow metal gold is ascended 0.53% to 1,910.70 dollars per ounce.
Market Wrap: Forex
The rouble tried to regain some stability on Tuesday after its crash to an all-time low, while the U.S. dollar resumed its rise against major peers as traders paused for breath amid the fast-moving Ukraine crisis.
Today, the U.S. dollar index measures the Redback against a trade-weighted basket of six major currencies, which is flat today to 96.670.
The Euro US Dollar (EUR/USD) is a widely traded pair that is positive today. This left the pair trading around $1.12260.
The Japanese yen was negative against the U.S. dollar on Tuesday as the stock down. Today USD/JPY is flat to 114.970 level.
Another commodity-related currency positive against the U.S dollar, AUD/USD gain 0.31% to 0.72850, and NZD/USD up 0.42% to 0.67870 level.
EUR/USD Intraday: In a Consolidation Zone
Our pivot point is at 1.11860
Preferable Price Action: Take Long positions Above pivot level with targets at 1.12250 & 1.12580 in extension.
Alternative Price Action: Above pivot looks for a further downside to 1.11460 & 1.11130.
Comment: RSI Below 50 levels and Pair Below 20MA.
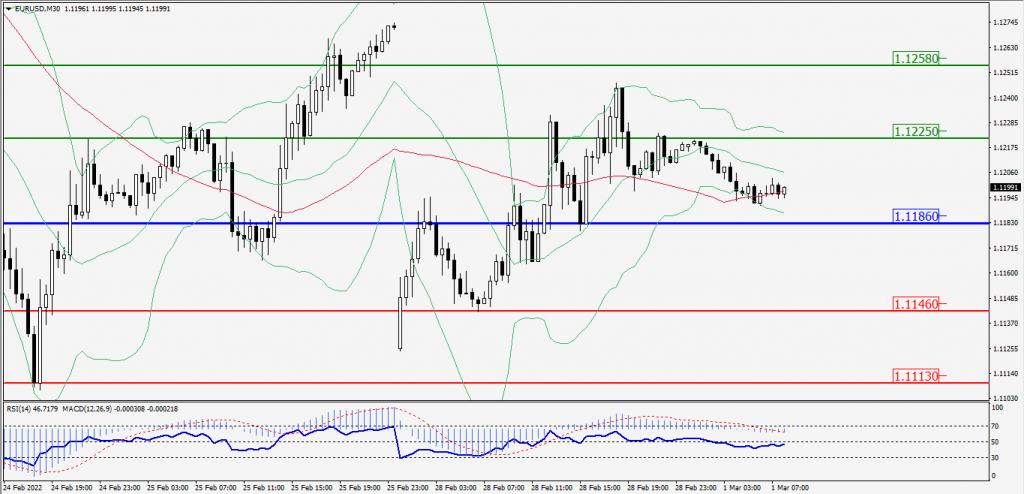
Green Lines Indicate Resistance Levels – Red Lines Indicates Support Levels
Light Blue is a Pivot Point – Black represents the price when the report was produced
GBP/USD Intraday: Major Support Level at 1.33670
Our pivot point is at 1.33670
Preferable Price Action: Buy positions Above pivot with targets at 1.34950 & 1.36020 in extension.
Alternative Price Action: The price Below pivot would call for further Downside to 1.32360 & 1.31250.
Comment: RSI above 50 levels and Pair Above 55MA.
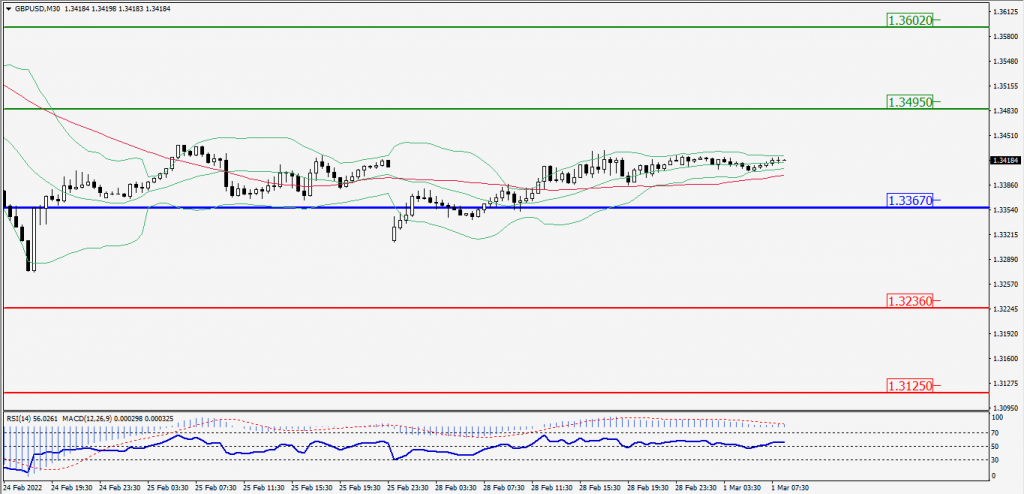
Green Lines Indicate Resistance Levels – Red Lines Indicates Support Levels
Light Blue is a Pivot Point – Black represents the price when the report was produced
USD/JPY Intraday: Resistance Level at 115.440
Our pivot point is at 115.440
Preferable Price Action: Sell position Below pivot with the target at 114.850 and 114.360 in extension.
Alternative Price Action: The Upside breakout of the pivot would call for 116.020 and 116.520.
Comment: MACD in Negative territory and Pair Below 55MA.
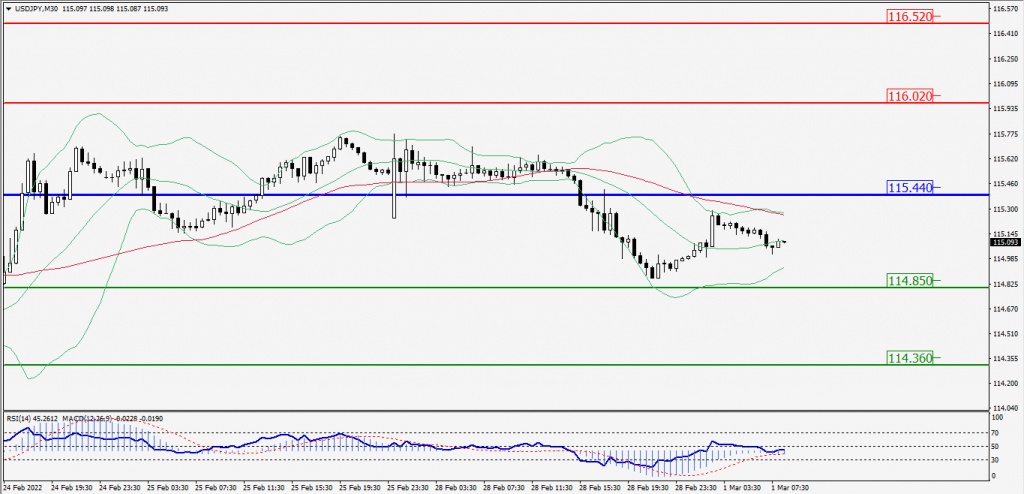
Green Lines Indicate Resistance Levels – Red Lines Indicates Support Levels
Light Blue is a Pivot Point – Black represents the price when the report was produced
AUD/USD Intraday: Major Trend on the Upside
Our pivot point is at 0.72510
Preferable Price Action: Buy Positions Above pivot with targets at 0.73120 & 0.73650 in extension.
Alternative Price Action: Below pivot looks for a further Downside with 0.71820 & 0.71260 as targets.
Comment: Pair Above its 20MA & 55MA and RSI above 50 levels.
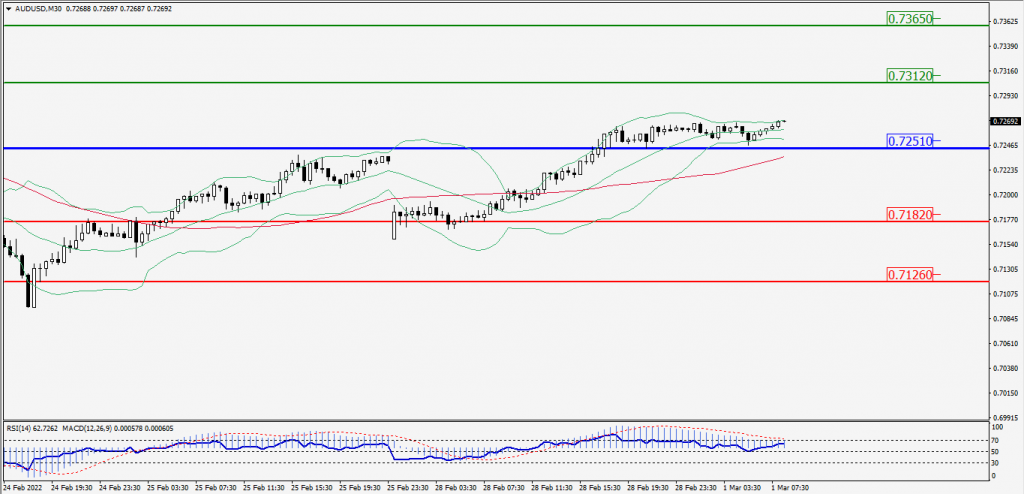
Green Lines Indicate Resistance Levels – Red Lines Indicates Support Levels
Light Blue is a Pivot Point – Black represents the price when the report was produced
CRUDEOIL Intraday: In a Consolidation Zone
Our pivot point is at 95.80
Preferable Price Action: Above pivots Buy Oil with 97.95 & 99.65 as targets.
Alternative Price Action: Sell crude Below pivot with targets at 93.65 and 92.00 in extension.
Comment: MACD is in the Positive territory and Pair Above its 20MA & 55MA.
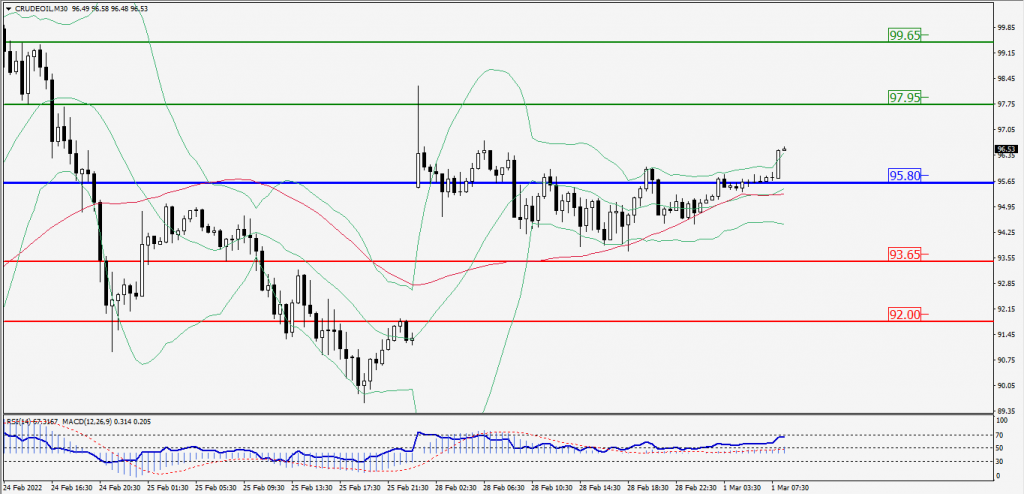
Green Lines Indicate Resistance Levels – Red Lines Indicates Support Levels
Light Blue is a Pivot Point – Black represents the price when the report was produced
XAU/USD Intraday: Support Level at 1897.80
Our pivot point is 1897.80
Preferable Price Action: Further Upside to 1921.40 and 1940.30.
Alternative Price Action: If the price gives a Downside breakout of a pivot, then the price extends to 1873.30 and 1855.60.
Comment: MACD is a Neutral territory.
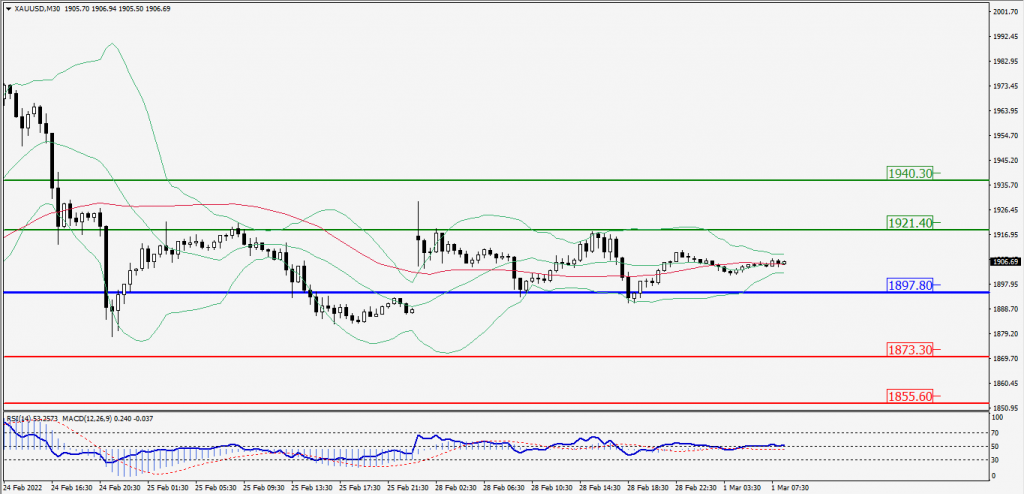
Green Lines Indicate Resistance Levels – Red Lines Indicates Support Levels
Light Blue is a Pivot Point – Black represents the price when the report was produced
Dow Jones Intraday: Trend on the Upside
Our pivot point is 33,533.00
Preferable Price Action: Take Long positions Above pivot with targets at 34,457.00 & 35,242.00.
Alternative Price Action: Below 33,533.00 looks for further Downside to 32,599.00 & 31,833.00.
Comment: Price Above its 20MA & 55MA and RSI above 50 levels.
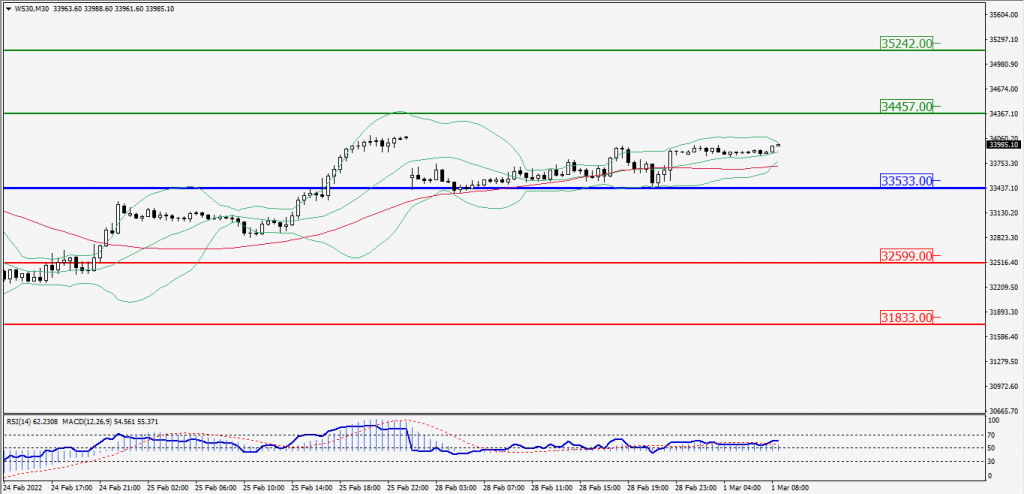
Green Lines Indicate Resistance Levels – Red Lines Indicates Support Levels
Light Blue is a Pivot Point – Black represents the price when the report was produced