Market Wrap: Stocks, Bonds, Commodities
Wall Street ended lower on Thursday, crossing the finish line of a grim month and quarter, a dismal coda to the S&P 500’s worst first half in more than half a century.
The Dow Jones Industrial Average fell 253.88 points to 30,775.43, the S&P 500 lose 33.45 points to 3,785.38 and the Nasdaq Composite subtract 149.16 points to 11,028.74.
MSCI’s index of Asia-Pacific stocks outside Japan is drop 0.88% to 647.34 levels. Australian index lower 0.43% to 6,539.90. Japanese Nikkei Index drop 1.73% to 25,935.62.
European stocks were positive on Friday, with the Stoxx Europe 50 Index rose 0.21% to 3,461.95, Germany’s DAX advance 0.34% to 12,830.46, and France’s CAC gain 0.44% to 5,949.11, and U.K.’s FTSE 100 surge 0.23% to 7,184.70.
Benchmark 10-year U.S. Treasury fell as demand for safe assets ascend again, today 10-year bond yields a positive 0.87% to 3.0000.
Oil prices fell on Friday, extending the previous day’s plunge, as lingering fears of a recession weighed on sentiment, putting the benchmarks on track for their third straight weekly losses.
Spot Brent crude oil add 1.97% to $111.18 per barrel. US West Texas Intermediate crude is up 1.85% to $107.67 a barrel.
The yellow metal gold is decline 0.70% to 1,794.60 dollars per ounce.
Market Wrap: Forex
The U.S. dollar edged higher in early European trade Friday, trading close to the highs of the year on safe-haven demand as central banks take on inflation at the expense of economic growth.
Today, the U.S. dollar index measures the Greenback against a trade-weighted basket of six major currencies, which is a rose 0.29% to 104.770.
The Euro US Dollar (EUR/USD) is a widely traded pair that is down 0.27% today. This left the pair trading around $1.04540.
The Japanese yen was positive against the U.S. dollar on Friday as the stock up. Today USD/JPY is drop 0.17% to 135.510 level.
Another commodity-related currency negative against the U.S dollar, AUD/USD lose 1.29% to 0.68130, and NZD/USD down 0.96 to 0.61810 level.
EUR/USD Intraday: Trend on the downside
Our pivot point is at 1.04950
Preferable Price Action: Take sell positions below pivot level with targets at 1.03920 & 1.03170 in extension.
Alternative Price Action: Above pivot looks for a further upside to 1.05880 & 1.06560.
Comment: RSI below 50 levels and Pair below 20MA.
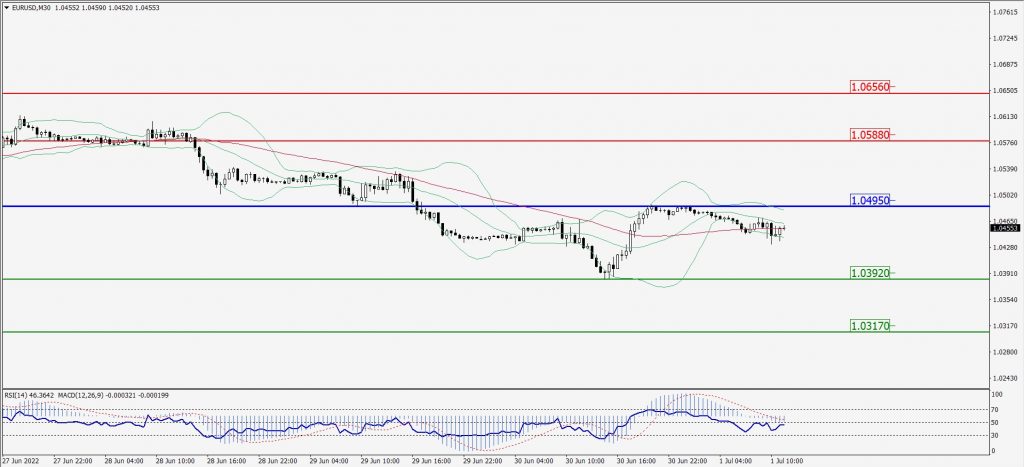
Green Lines Indicate Resistance Levels – Red Lines Indicate Support Levels
Light Blue is a Pivot Point – Black represents the price when the report was produced
GBP/USD Intraday: Trend on the downside
Our pivot point is at 1.21470
Preferable Price Action: Sell positions below pivot with targets at 1.20370 & 1.19600 in extension.
Alternative Price Action: The price above pivot would call for further upside to 1.22400 & 1.23180.
Comment: RSI below 50 levels pair below its 20MA & 55MA.
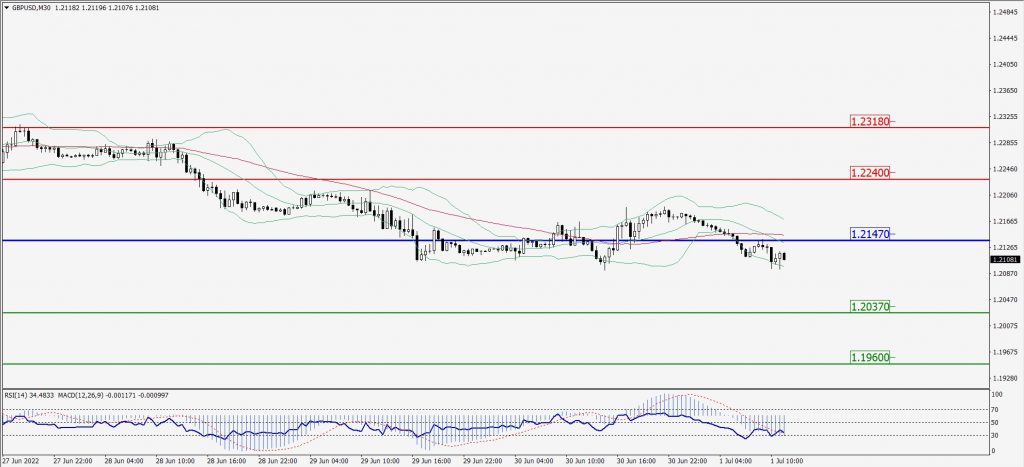
Green Lines Indicate Resistance Levels – Red Lines Indicate Support Levels
Light Blue is a Pivot Point – Black represents the price when the report was produced
USD/JPY Intraday: Trend on the upside
Our pivot point is at 135.380
Preferable Price Action: Buy position above pivot with the target at 136.550 and 137.540 in extension.
Alternative Price Action: The downside breakout of the pivot would call for 134.320 and 133.350.
Comment: MACD is positive territory and Pair above 20MA.
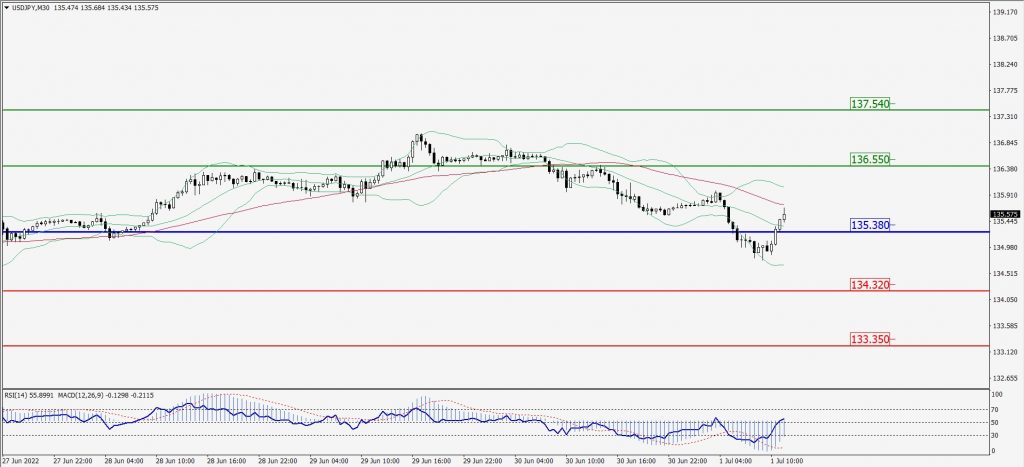
Green Lines Indicate Resistance Levels – Red Lines Indicate Support Levels
Light Blue is a Pivot Point – Black represents the price when the report was produced
AUD/USD Intraday: Resistance level at 0.68360
Our pivot point is at 0.68360
Preferable Price Action: Sell Positions below pivot with targets at 0.67660 & 0.67170 in extension.
Alternative Price Action: Above pivot looks for a further upside with 0.68950 & 0.69400 as targets.
Comment: RSI below 50 levels and Pair below its 20MA & 55MA.
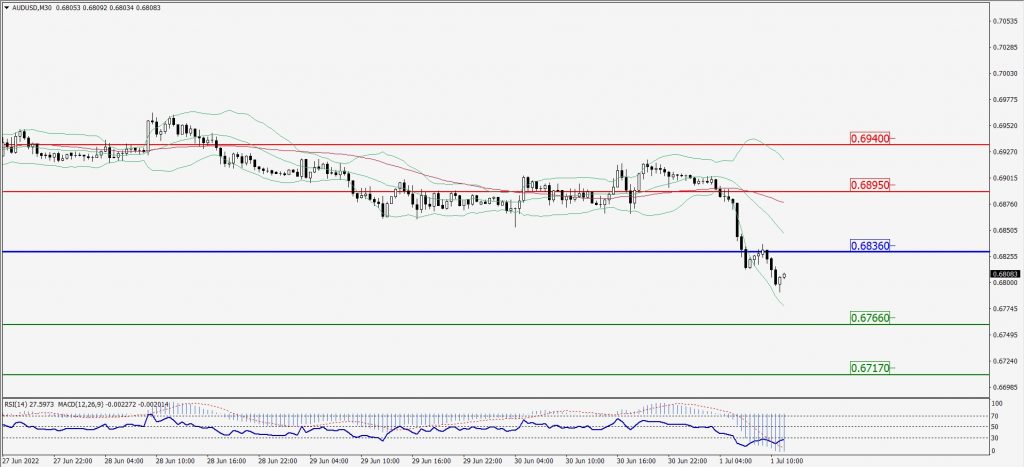
Green Lines Indicate Resistance Levels – Red Lines Indicate Support Levels
Light Blue is a Pivot Point – Black represents the price when the report was produced
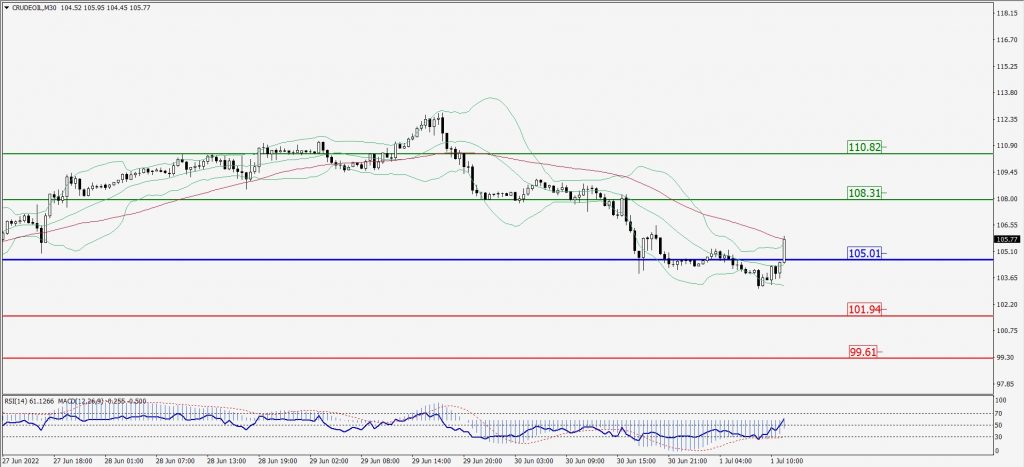
CRUDEOIL Intraday: Support level at 105.01
Our pivot point is at 105.01
Preferable Price Action: Above pivots buy oil with 108.31 & 110.82 as targets.
Alternative Price Action: Sell crude below pivot with targets at 101.94 and 99.61 in extension.
Comment: MACD is in the positive territory and Pair above 20MA.
Green Lines Indicate Resistance Levels – Red Lines Indicate Support Levels
Light Blue is a Pivot Point – Black represents the price when the report was produced
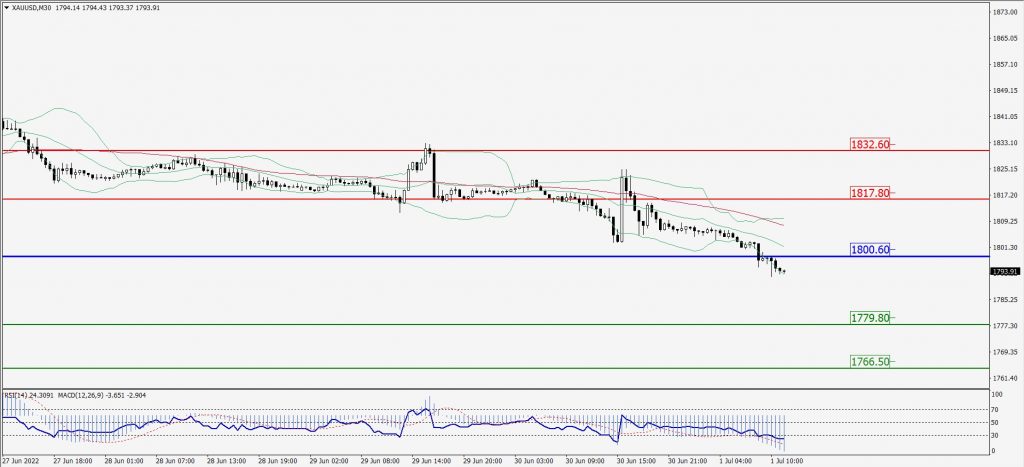
XAU/USD Intraday: Major trend on the downside
Our pivot point is 1800.60
Preferable Price Action: Further downside to 1779.80 and 1766.50
Alternative Price Action: If the price gives an upside breakout of a pivot, then the price extends to 1817.80 and 1832.60.
Comment: MACD is negative territory and Pair below its 20MA & 55MA.
Green Lines Indicate Resistance Levels – Red Lines Indicate Support Levels
Light Blue is a Pivot Point – Black represents the price when the report was produced
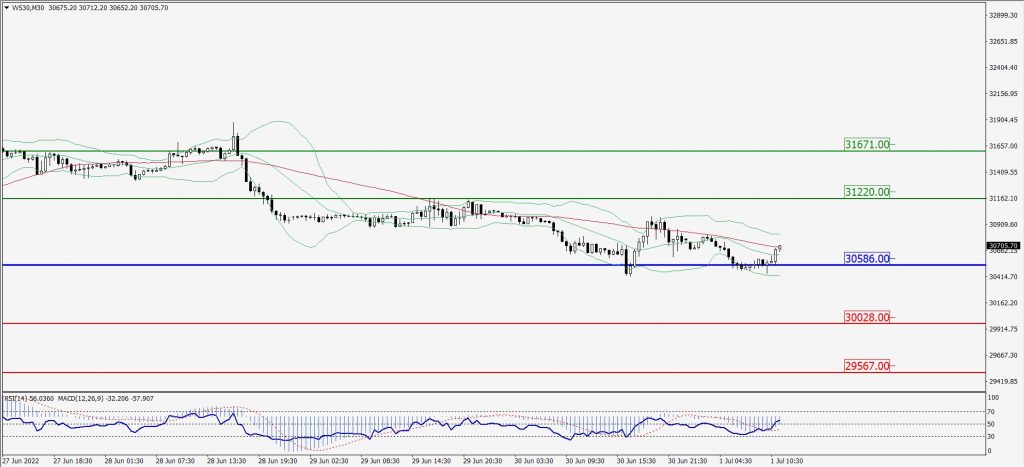
Dow Jones Intraday: Major support level at 30,586.00
Our pivot point is 30,586.00
Preferable Price Action: Take buy positions above pivot with targets at 31,220.00 & 31,671.00.
Alternative Price Action: Below 30,586.00 looks for further downside to 30,028.00 & 29,567.00.
Comment: RSI above 50 levels and Pair above 20MA.
Green Lines Indicate Resistance Levels – Red Lines Indicate Support Levels
Light Blue is a Pivot Point – Black represents the price when the report was produced