Market Wrap: Stocks, Bonds, Commodities
Wall Street closed higher on Thursday as market participants were reassured by US Treasury Secretary Janet Yellen’s reassurances that measures will be taken to keep Americans’ deposits safe.
The Dow Jones Industrial Average rosse 75.14 points to 32,105.25, the S&P 500 gain 0.30% to 3,948.72 and the Nasdaq Composite add 117.44 points to 11,787.40.
MSCI’s index of Asia-Pacific stocks outside Japan is decline 0.34% to 636.57 levels. The Australian index was lower by 0.19% to 6,955.20. Japanese Nikkei Index decline 0.13% today.
European stocks were negative on Friday, with the Stoxx Europe 50 Index fell 0.58% to 4,180.14, Germany’s DAX decline 0.04% to 15,159.08, and France’s CAC drop 0.43% to 7,103.73, and U.K.’s FTSE 100 subtract 0.49% to 7,465.70.
Benchmark 10-year U.S. Treasury fell as demand for safe assets ascend again, today 10-year bond yields are negative 0.54% to 3.3850.
Oil prices settled 1 percent lower on Thursday, reversing early gains after US Energy Secretary Jennifer Granholm told lawm0akers that refilling the country’s Strategic Petroleum Reserve (SPR) may take several years.
Spot Brent crude oil drop 0.33% to $75.67 per barrel. US West Texas Intermediate crude is down 0.40% to $69.66 a barrel.
The yellow metal gold is decline 0.23% to 1,991.30 dollars per ounce.
Market Wrap: Forex
Most Asian currencies fell on Friday and the dollar steadied near seven-week lows as markets speculated over how imminent a pause in interest hikes may be, although dovish signals from the Federal Reserve put most regional units on course for strong weekly gains.
Today, the U.S. dollar index measures the Greenback against a trade-weighted basket of six major currencies, which surged 0.06% to 102.260.
The Euro US Dollar (EUR/USD) is a widely traded pair that is down 0.02% today. This left the pair trading around $1.08280.
The Japanese yen was negative against the U.S. dollar on Friday. Today USD/JPY is slipped 0.44% to the 130.24 level.
Another commodity-related currency negative against the U.S dollar, AUD/USD fell 0.06% to 0.66850, and NZD/USD slipped 0.21% to 0.62370 level.
EUR/USD Intraday: Trend on the downside
Our pivot point is at 1.08460
Preferable Price Action: Take sell positions below pivot level with targets at 1.08070 & 1.07830 in extension.
Alternative Price Action: Above pivot looks for a further upside to 1.08830 & 1.09090.
Comment: RSI is below 50 levels and Pairs below its 20MA & 55MA.
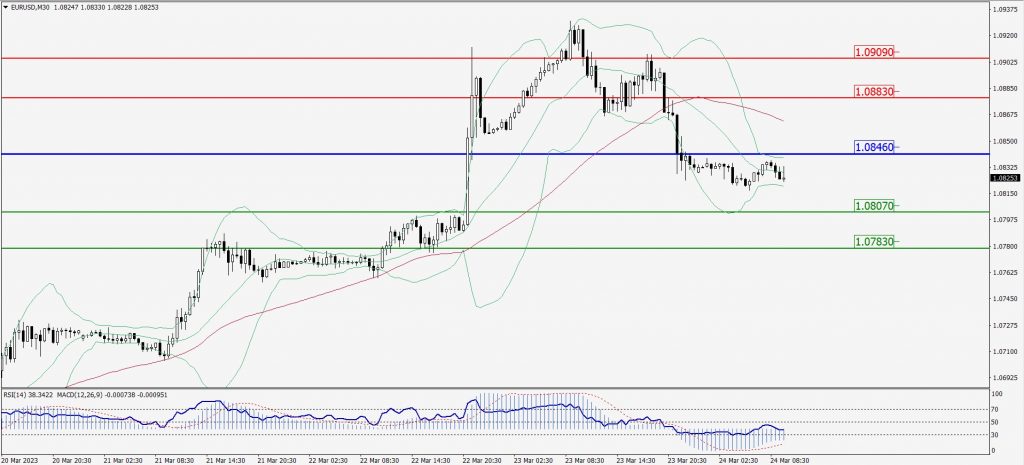
Green Lines Indicate Resistance Levels – Red Lines Indicate Support Levels
Light Blue is a Pivot Point – Black represents the price when the report was produced
GBP/USD Intraday: Resistance level at 1.22910
Our pivot point is at 1.22910
Preferable Price Action: Sell positions below pivot with targets at 1.22640 & 1.22450 in extension.
Alternative Price Action: The price above pivot would call for further upside to 1.23170 & 1.23380.
Comment: RSI is below 50 levels and Pairs below 55MA.
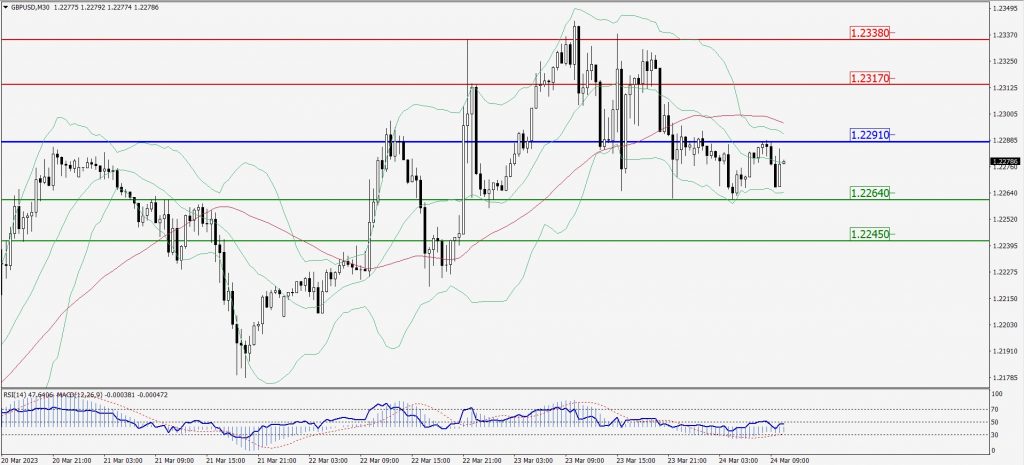
Green Lines Indicate Resistance Levels – Red Lines Indicate Support Levels
Light Blue is a Pivot Point – Black represents the price when the report was produced
USD/JPY Intraday: Trend on the downside
Our pivot point is at 130.610
Preferable Price Action: Sell position below pivot with the target at 130.110 and 129.720 in extension.
Alternative Price Action: The upside breakout of the pivot would call for 131.070 and 131.510.
Comment: MACD is below 50 level and Pairs below its 20MA & 55MA.
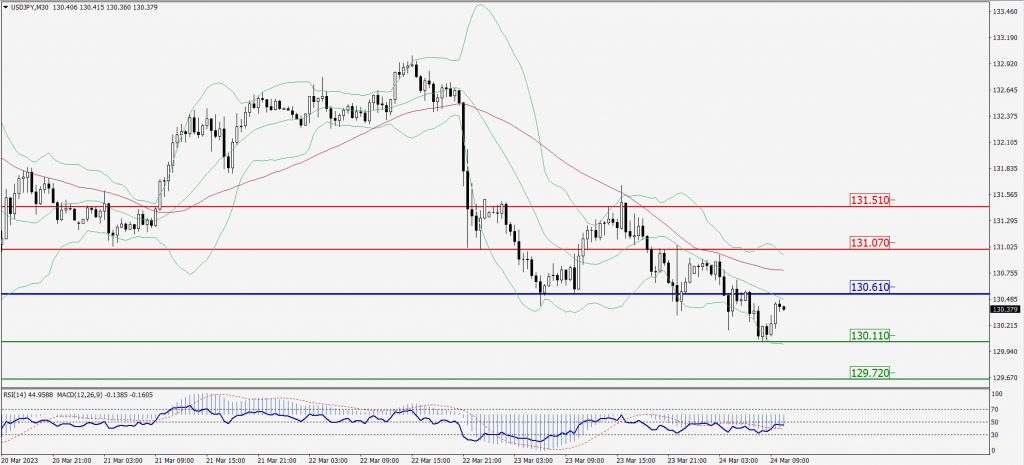
Green Lines Indicate Resistance Levels – Red Lines Indicate Support Levels
Light Blue is a Pivot Point – Black represents the price when the report was produced
AUD/USD Intraday: Support level at 0.66850
Our pivot point is at 0.66850
Preferable Price Action: Buy positions above pivot with targets at 0.67050 & 0.67200 in extension.
Alternative Price Action: Below pivot looks for a further downside with 0.66670 & 0.66540 as targets.
Comment: RSI is above 50 levels and pairs above 20MA.
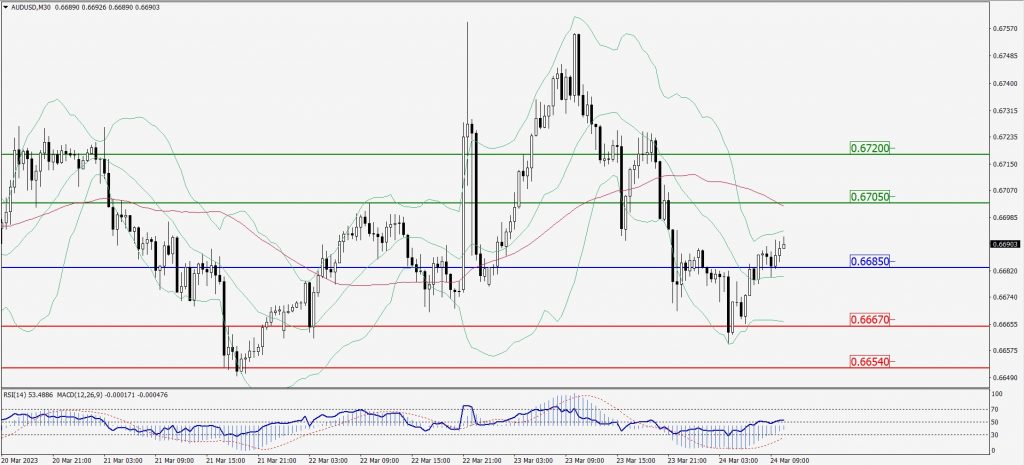
Green Lines Indicate Resistance Levels – Red Lines Indicate Support Levels
Light Blue is a Pivot Point – Black represents the price when the report was produced
CRUDEOIL Intraday: Trend on the upside
Our pivot point is at 70.17
Preferable Price Action: Above pivot buy oil with 71.49 & 72.40 as targets.
Alternative Price Action: Sell crude below pivot with targets at 69.09 and 68.26 in extension.
Comment: MACD is positive territory and Pairs above its 20MA & 55MA.
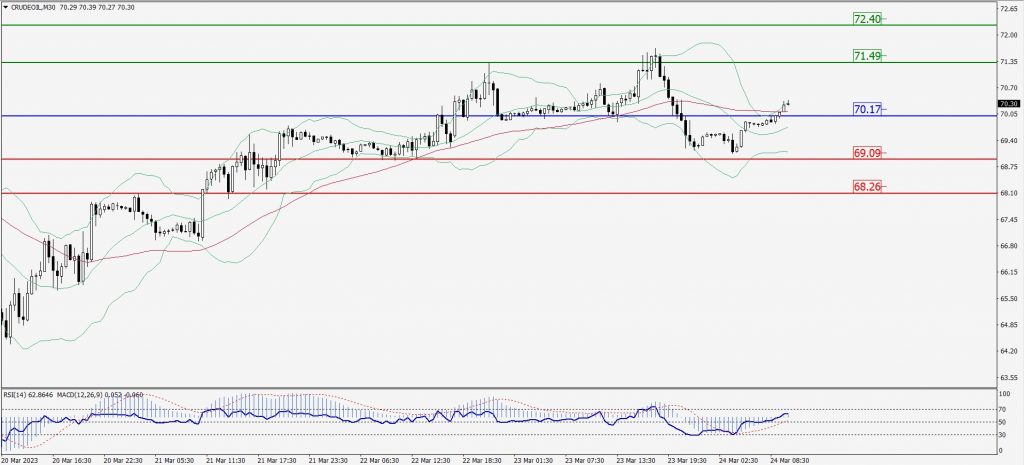
Green Lines Indicate Resistance Levels – Red Lines Indicate Support Levels
Light Blue is a Pivot Point – Black represents the price when the report was produced
XAU/USD Intraday: Trend on the downside
Our pivot point is 1995.20
Preferable Price Action: Further downside to 1981.30 and 1971.70
Alternative Price Action: If the price gives an upside breakout of a pivot, then the price extends to 2007.20 and 2016.90.
Comment: MACD is below 50 level and Pairs below 20MA.
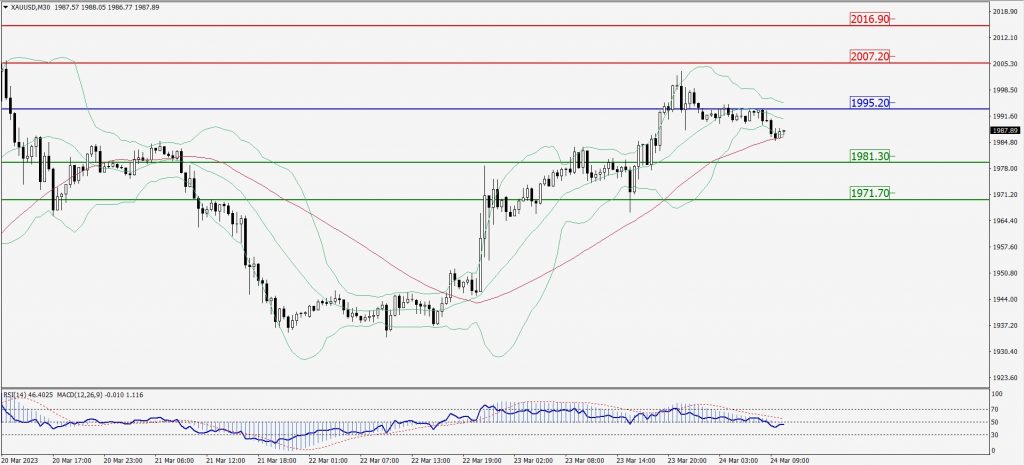
Green Lines Indicate Resistance Levels – Red Lines Indicate Support Levels
Light Blue is a Pivot Point – Black represents the price when the report was produced
Dow Jones Intraday: Trend on the upside
Our pivot point is 32,279.00
Preferable Price Action: Take sell positions below the pivot with targets at 32,093.00 & 31,962.00.
Alternative Price Action: Above 32,279.00 looks for further upside to 32,457.00 & 32,590.00.
Comment: RSI is below 50 levels and Pairs below 55MA.
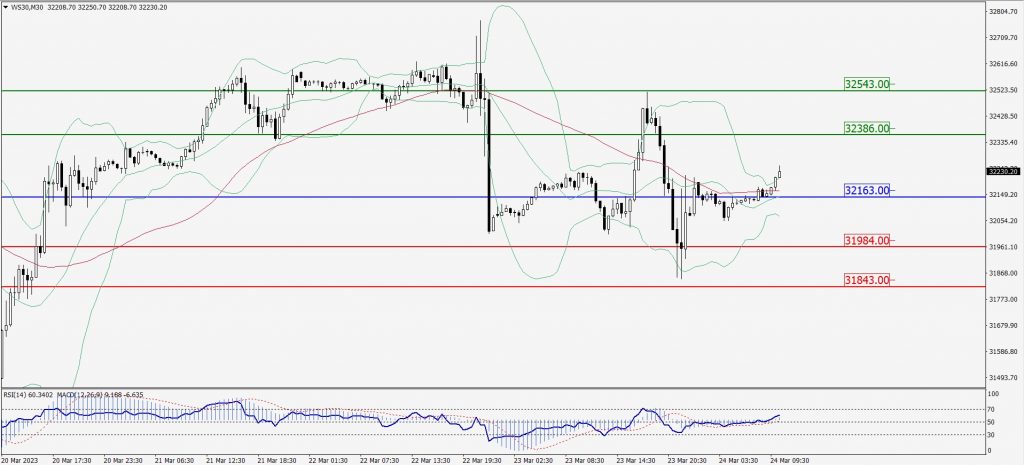
Green Lines Indicate Resistance Levels – Red Lines Indicate Support Levels
Light Blue is a Pivot Point – Black represents the price when the report was produced