Market Wrap: Stocks, Bonds, Commodities
Wall Street closed sharply higher on Tuesday as widespread fears over liquidity in the banking sector abated and market participants eyed the Federal Reserve, which is expected to conclude its two-day policy meeting on Wednesday with a 25 basis-point hike to its policy rate.
The Dow Jones Industrial Average rose 316.02 points to 32,560.60, the S&P 500 gain 1.30% to 4,002.87 and the Nasdaq Composite add 184.57 points to 11,860.11.
MSCI’s index of Asia-Pacific stocks outside Japan is advance 1.20% to 626.76 levels. The Australian index was higher by 0.87% to 7,015.60. Japanese Nikkei Index advance 1.93% today.
European stocks were negative on Wednesday, with the Stoxx Europe 50 Index fell 0.29% to 4,170.45, Germany’s DAX decline 0.17% to 15,167.15, and France’s CAC drop 0.45% to 7,080.77, and U.K.’s FTSE 100 subtract 0.36% to 7,510.18.
Benchmark 10-year U.S. Treasury fell as demand for safe assets ascend again, today 10-year bond yields are negative 0.75% to 3.5790.
Oil prices rose more than 2 percent on Tuesday, extending a retreat from a 15-month low hit the previous day, as the rescue of Credit Suisse allayed concerns of a banking crisis that would hurt economic growth and cut fuel demand.
Spot Brent crude oil drop 0.46% to $74.97 per barrel. US West Texas Intermediate crude is down 0.63% to $69.22 a barrel.
The yellow metal gold is advance 0.28% to 1,946.55 dollars per ounce.
Market Wrap: Forex
The dollar was pinned near five-week lows on Wednesday ahead of the conclusion of the U.S. Federal Reserve’s policy meeting, with investors awaiting clarity on the path the central bank is likely to take in the wake of global banking turmoil.
Today, the U.S. dollar index measures the Greenback against a trade-weighted basket of six major currencies, which slipped 0.08% to 102.810.
The Euro US Dollar (EUR/USD) is a widely traded pair that is up 0.05% today. This left the pair trading around $1.07720.
The Japanese yen was negative against the U.S. dollar on Wednesday. Today USD/JPY is surged 0.70% to the 132.240 level.
Another commodity-related currency positive against the U.S dollar, AUD/USD rose 0.30% to 0.66880, and NZD/USD surged 0.28% to 0.62110 level.
EUR/USD Intraday: Resistance level at 1.07800
Our pivot point is at 1.07800
Preferable Price Action: Take sell positions below pivot level with targets at 1.07300 & 1.06970 in extension.
Alternative Price Action: Above pivot looks for a further upside to 1.08230 & 1.08570.
Comment: RSI is below 50 levels and Pairs below 20MA.
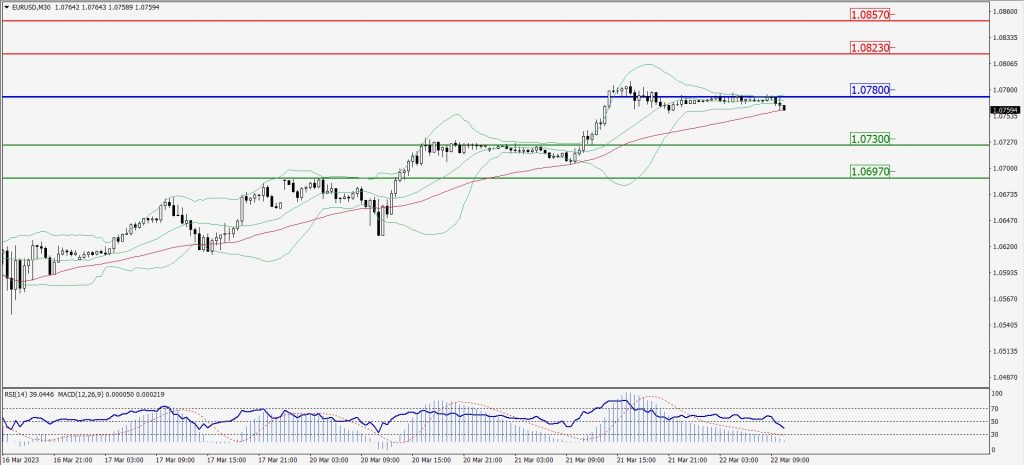
Green Lines Indicate Resistance Levels – Red Lines Indicate Support Levels
Light Blue is a Pivot Point – Black represents the price when the report was produced
GBP/USD Intraday: Major trend on the upside
Our pivot point is at 1.22520
Preferable Price Action: Buy positions above pivot with targets at 1.23130 & 1.23550 in extension.
Alternative Price Action: The price below pivot would call for further downside to 1.22030 & 1.21660.
Comment: RSI is above 50 levels and Pairs above its 20MA & 55MA.
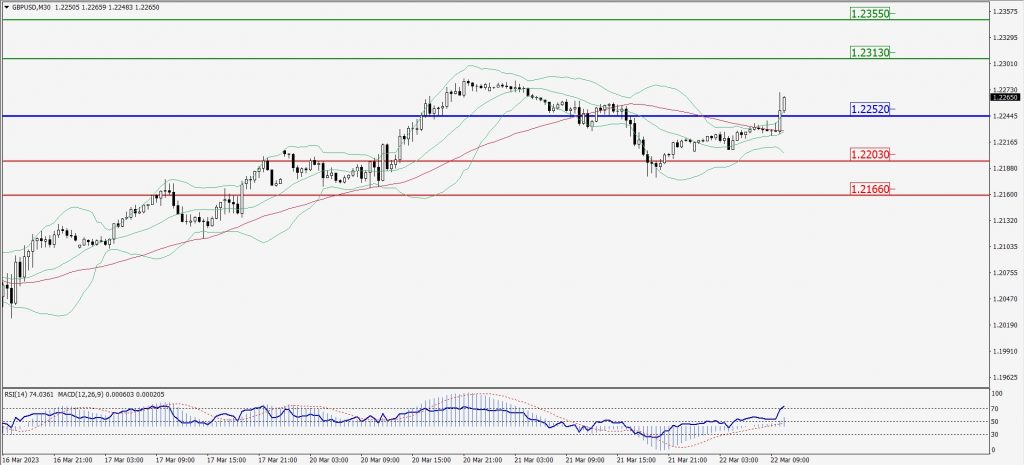
Green Lines Indicate Resistance Levels – Red Lines Indicate Support Levels
Light Blue is a Pivot Point – Black represents the price when the report was produced
USD/JPY Intraday: Trend on the upside
Our pivot point is at 132.350
Preferable Price Action: Buy position above pivot with the target at 132.850 and 133.260 in extension.
Alternative Price Action: The downside breakout of the pivot would call for 131.870 and 131.510.
Comment: MACD is above 50 level and Pairs above its 20MA & 55MA.
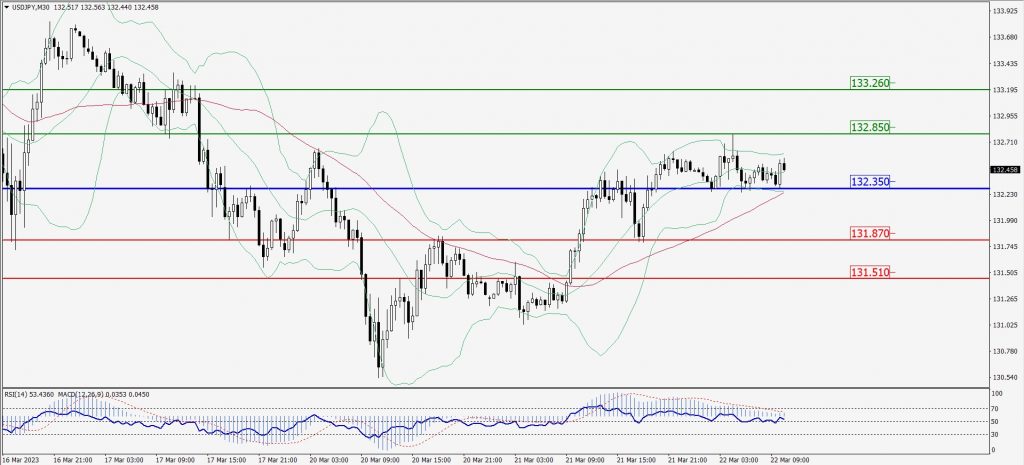
Green Lines Indicate Resistance Levels – Red Lines Indicate Support Levels
Light Blue is a Pivot Point – Black represents the price when the report was produced
AUD/USD Intraday: Trend on the upside
Our pivot point is at 0.66870
Preferable Price Action: Buy positions above pivot with targets at 0.67030 & 0.67150 in extension.
Alternative Price Action: Below pivot looks for a further downside with 0.66730 & 0.66610 as targets.
Comment: RSI is above 50 levels and pairs above its 20MA & 55MA.
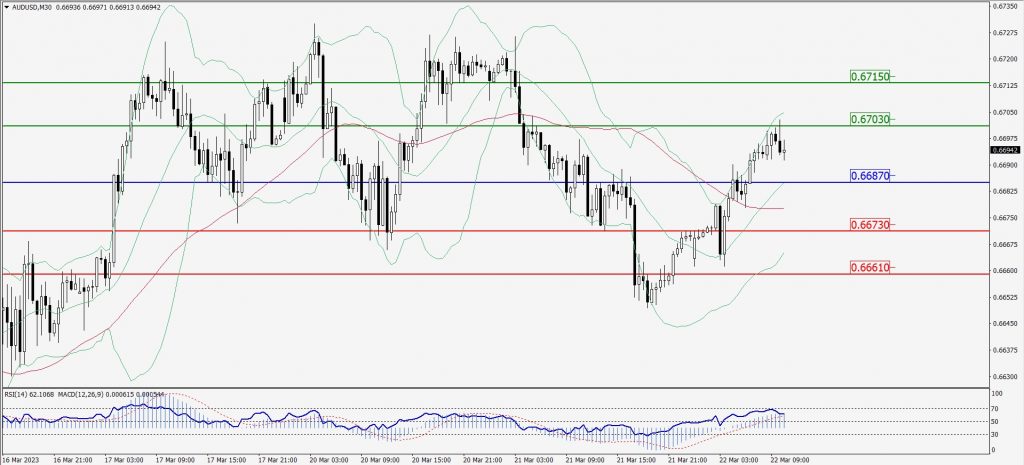
Green Lines Indicate Resistance Levels – Red Lines Indicate Support Levels
Light Blue is a Pivot Point – Black represents the price when the report was produced
CRUDEOIL Intraday: In a consolidation zone
Our pivot point is at 69.74
Preferable Price Action: Below pivot sell oil with 68.41 & 67.38 as targets.
Alternative Price Action: Buy crude above pivot with targets at 70.98 and 71.93 in extension.
Comment: MACD is flat territory and Pairs below 20MA.
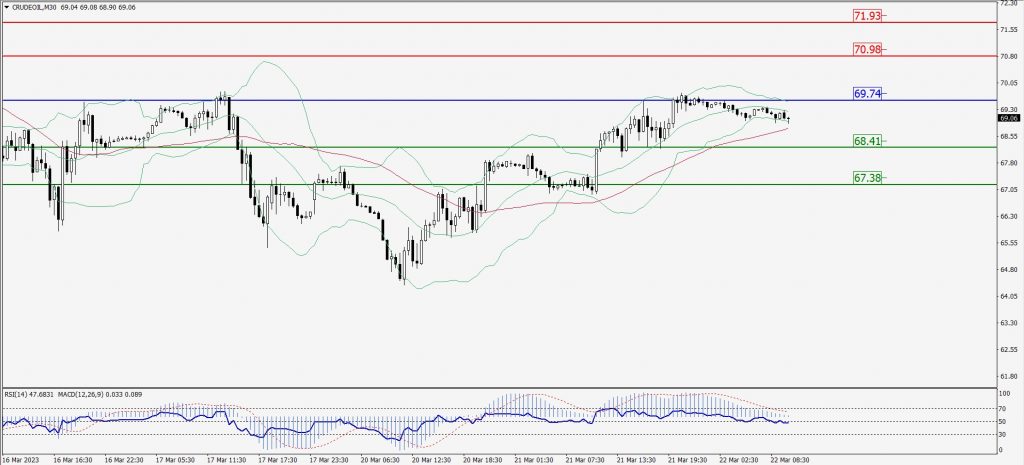
Green Lines Indicate Resistance Levels – Red Lines Indicate Support Levels
Light Blue is a Pivot Point – Black represents the price when the report was produced
XAU/USD Intraday: Trend on the downside
Our pivot point is 1946.30
Preferable Price Action: Further downside to 1930.10 and 1919.30
Alternative Price Action: If the price gives an upside breakout of a pivot, then the price extends to 1961.00 and 1973.30.
Comment: MACD is below 50 level and Pairs below its 20MA & 55MA.
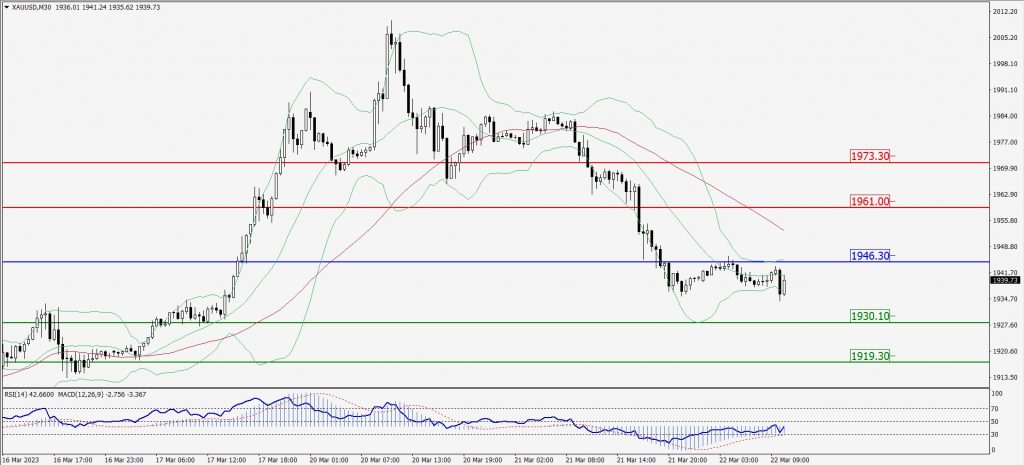
Green Lines Indicate Resistance Levels – Red Lines Indicate Support Levels
Light Blue is a Pivot Point – Black represents the price when the report was produced
Dow Jones Intraday: Resistance level at 32,588.00
Our pivot point is 32,588.00
Preferable Price Action: Take sell positions below the pivot with targets at 32,349.00 & 32,183.00.
Alternative Price Action: Above 32,588.00 looks for further upside to 32,808.00 & 32,988.00.
Comment: RSI is below 50 levels and Pairs below 20MA.
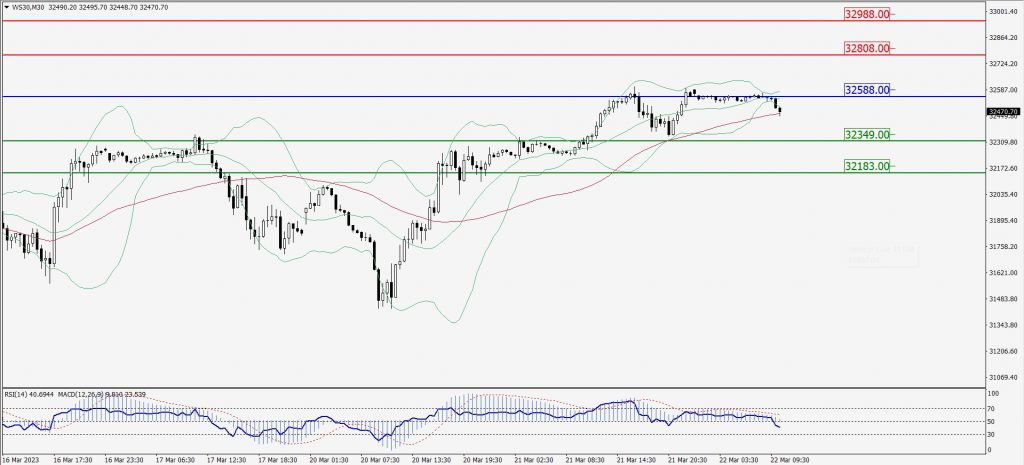
Green Lines Indicate Resistance Levels – Red Lines Indicate Support Levels
Light Blue is a Pivot Point – Black represents the price when the report was produced