Market Wrap: Stocks, Bonds, Commodities
A strong rebound by financials helped Wall Street’s main indexes close firmly positive on Thursday after some of the country’s largest lenders came to the rescue of embattled First Republic Bank.
The Dow Jones Industrial Average rose 371.98 points to 32,246.55, the S&P 500 gain 1.76% to 3,960.28 and the Nasdaq Composite add 283.23 points to 11,717.28
MSCI’s index of Asia-Pacific stocks outside Japan is advance 1.57% to 621.88 levels. The Australian index was higher by 0.42% to 6,994.80. Japanese Nikkei Index advance 1.20% today.
European stocks were positive on Friday, with the Stoxx Europe 50 Index rose 0.93% to 4,155.45, Germany’s DAX advance 0.72% to 15,073.75, and France’s CAC ascend 0.56% to 7,065.09, and U.K.’s FTSE 100 add 0.97% to 7,482.32.
Benchmark 10-year U.S. Treasury fell as demand for safe assets ascend again, today 10-year bond yields are negative 1.22% to 3.5390.
Oil prices settled 1% higher on Thursday, ending a three-session losing streak, after reports that Saudi Arabia and Russia met to discuss ways to enhance market stability.
Spot Brent crude oil ascend 0.50% to $75.08 per barrel. US West Texas Intermediate crude is up 0.66% to $68.78 a barrel.
The yellow metal gold is advance 0.60% to 1,934.70 dollars per ounce.
Market Wrap: Forex
The U.S. dollar slipped lower in early European trade Friday and riskier currencies rallied on easing concerns about a global banking crisis.
Today, the U.S. dollar index measures the Greenback against a trade-weighted basket of six major currencies, which surged 0.36% to 103.710.
The Euro US Dollar (EUR/USD) is a widely traded pair that is up 0.49% today. This left the pair trading around $1.06580.
The Japanese yen was negative against the U.S. dollar on Friday. Today USD/JPY is slipped 0.50% to the 133.060 level.
Another commodity-related currency positive against the U.S dollar, AUD/USD rose 0.83% to 0.67090, and NZD/USD surged 0.85% to 0.62480 level.
EUR/USD Intraday: Trend on the upside
Our pivot point is at 1.06520
Preferable Price Action: Take buy positions above pivot level with targets at 1.06940 & 1.07250 in extension.
Alternative Price Action: Below pivot looks for a further downside to 1.06150 & 1.05880.
Comment: RSI is above 50 levels and Pairs above its 20MA & 55MA.
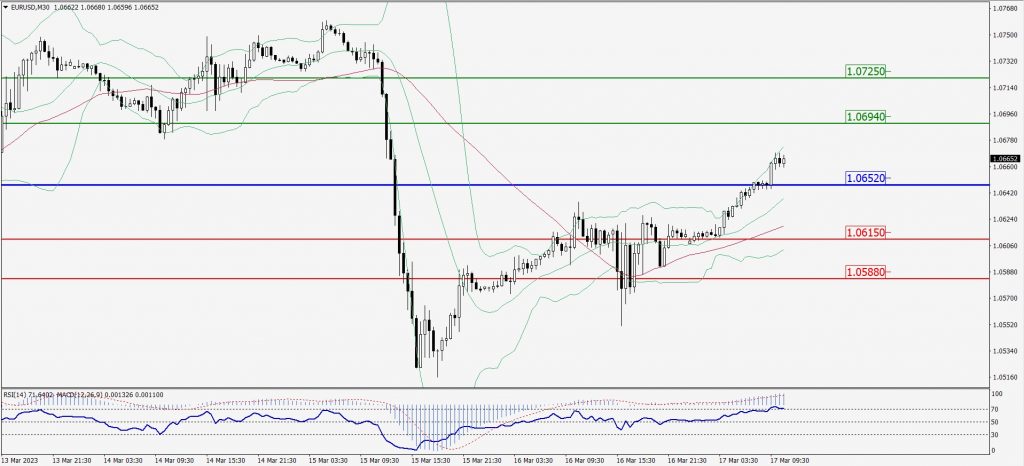
Green Lines Indicate Resistance Levels – Red Lines Indicate Support Levels
Light Blue is a Pivot Point – Black represents the price when the report was produced
GBP/USD Intraday: Support level at 1.21520
Our pivot point is at 1.21520
Preferable Price Action: Buy positions above pivot with targets at 1.21870 & 1.22110 in extension.
Alternative Price Action: The price below pivot would call for further downside to 1.21220 & 1.20990.
Comment: RSI is above 50 levels and Pairs above its 20MA & 55MA.
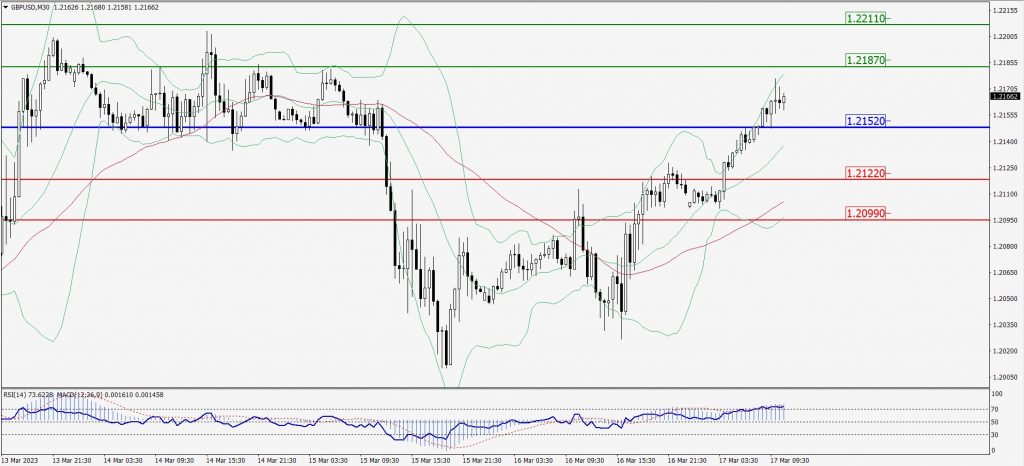
Green Lines Indicate Resistance Levels – Red Lines Indicate Support Levels
Light Blue is a Pivot Point – Black represents the price when the report was produced
USD/JPY Intraday: Resistance level at 133.460
Our pivot point is at 133.460
Preferable Price Action: Sell position below pivot with the target at 132.730 and 132.220 in extension.
Alternative Price Action: The upside breakout of the pivot would call for 134.130 and 134.670.
Comment: MACD is below 50 level and Pairs below 20MA.
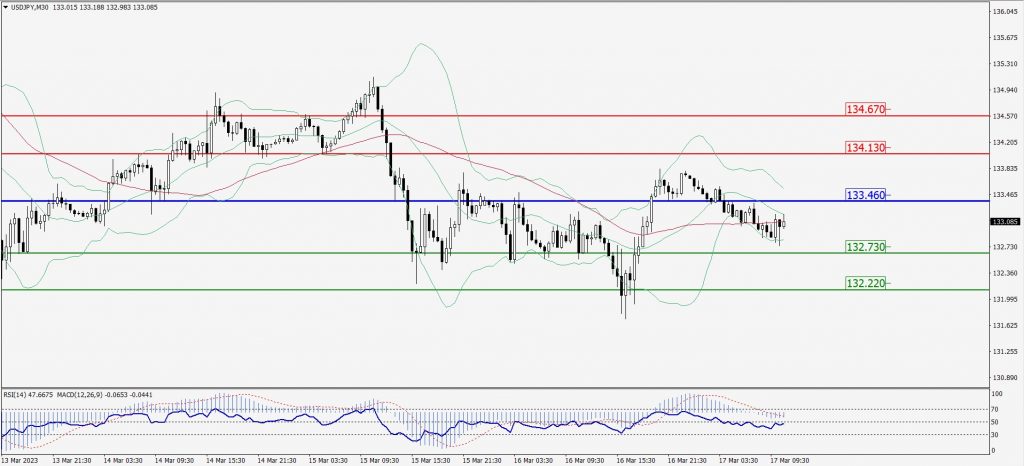
Green Lines Indicate Resistance Levels – Red Lines Indicate Support Levels
Light Blue is a Pivot Point – Black represents the price when the report was produced
AUD/USD Intraday: Major trend on the upside
Our pivot point is at 0.67100
Preferable Price Action: Buy positions above pivot with targets at 0.67420 & 0.67630 in extension.
Alternative Price Action: Below pivot looks for a further downside with 0.66810 & 0.66590 as targets.
Comment: RSI is above 50 levels and pairs above its 20MA & 55MA.
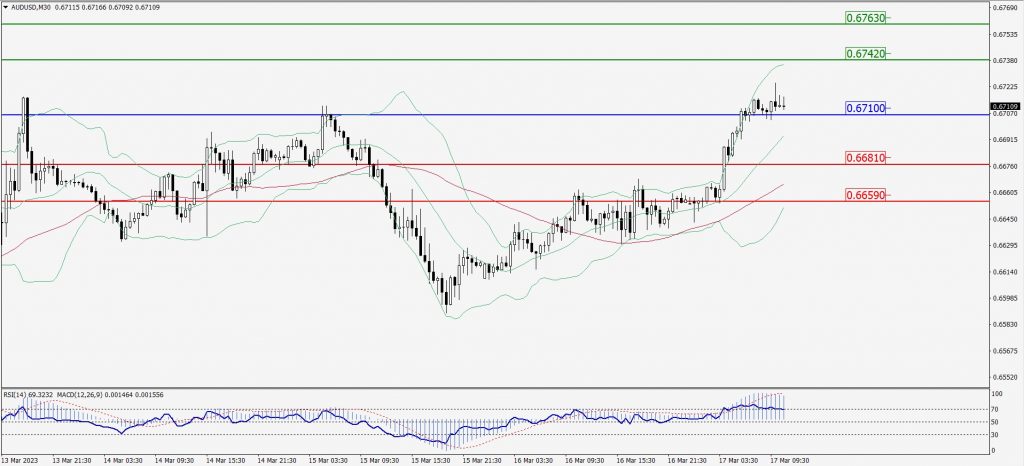
Green Lines Indicate Resistance Levels – Red Lines Indicate Support Levels
Light Blue is a Pivot Point – Black represents the price when the report was produced
CRUDEOIL Intraday: Support level at 68.99
Our pivot point is at 68.99
Preferable Price Action: Above pivot buy oil with 70.38 & 71.39 as targets.
Alternative Price Action: Sell crude below pivot with targets at 67.73 and 66.75 in extension.
Comment: MACD is positive territory and Pairs above its 20MA & 55MA.
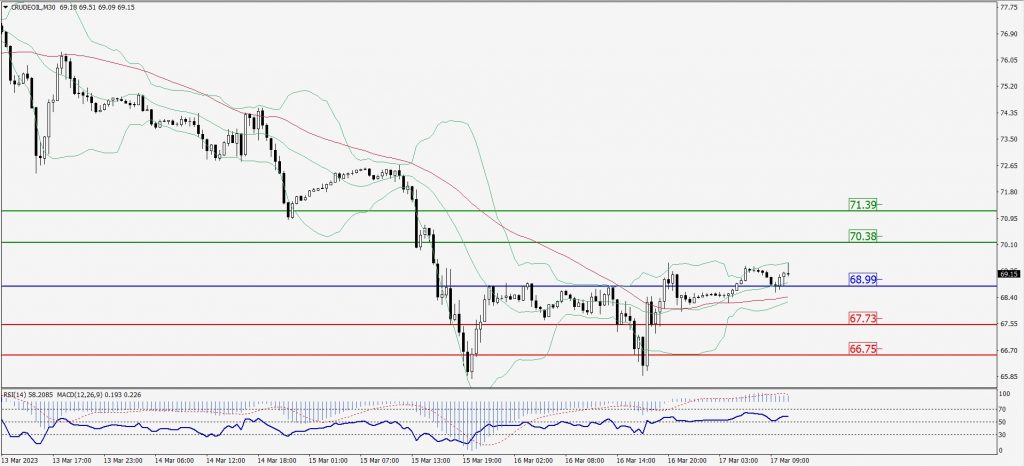
Green Lines Indicate Resistance Levels – Red Lines Indicate Support Levels
Light Blue is a Pivot Point – Black represents the price when the report was produced
XAU/USD Intraday: Trend on the upside
Our pivot point is 1924.70
Preferable Price Action: Further upside to 1936.80 and 1945.90
Alternative Price Action: If the price gives a downside breakout of a pivot, then the price extends to 1914.90 and 1907.10.
Comment: MACD is above 50 level and Pairs above its 20MA & 55MA.
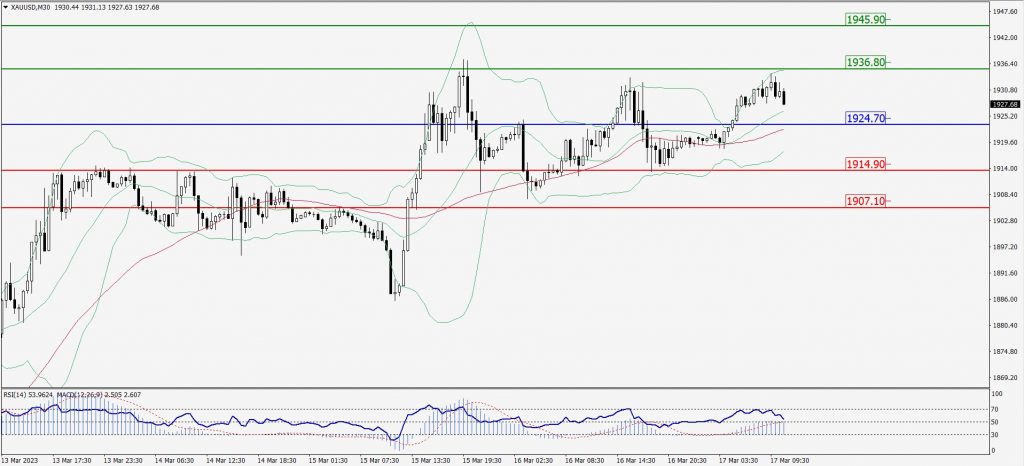
Green Lines Indicate Resistance Levels – Red Lines Indicate Support Levels
Light Blue is a Pivot Point – Black represents the price when the report was produced
Dow Jones Intraday: Trend on the upside
Our pivot point is 32,084.00
Preferable Price Action: Take buy positions above the pivot with targets at 32,451.00 & 32,597.00.
Alternative Price Action: Below 32,253.00 looks for further downside to 32,084.00 & 31,939.00.
Comment: RSI is above 50 levels and Pairs above its 20MA & 55MA.
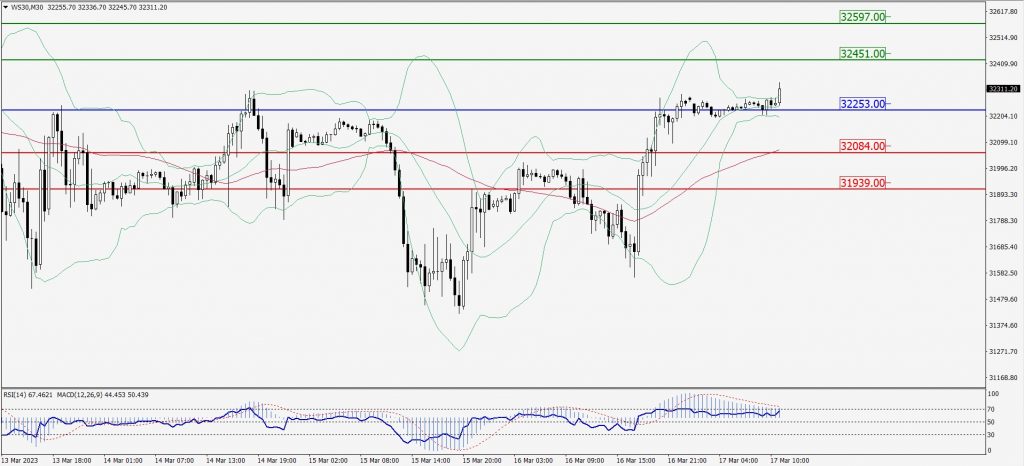
Green Lines Indicate Resistance Levels – Red Lines Indicate Support Levels
Light Blue is a Pivot Point – Black represents the price when the report was produced