Market Wrap: Stocks, Bonds, Commodities
The S&P 500 ended an indecisive session with a nominal increase and Treasury yields edged up on Wednesday as a spate of economic data appeared to support Federal Reserve Chairman Jerome Powell’s reassertion, in his second day of congressional testimony, that the central bank would continue to ratchet up policy rates until inflation subsides.
The Dow Jones Industrial Average fell 58.06 points to 32,798.40, the S&P 500 gain 0.14% to 3,992.01 and the Nasdaq Composite add 45.67 points to 11,576.00
MSCI’s index of Asia-Pacific stocks outside Japan is decline 0.76% to 627.71 levels. The Australian index was higher by 0.05% to 7,311.10. Japanese Nikkei Index rose 0.63% today.
European stocks were negative on Thursday, with the Stoxx Europe 50 Index lose 0.30% to 4,275.75, Germany’s DAX decline 0.06% to 15,622.65, and France’s CAC drop 0.38% to 7,296.80, and U.K.’s FTSE 100 subtract 0.63% to 7,879.85.
Benchmark 10-year U.S. Treasury fell as demand for safe assets ascend again, today 10-year bond yields are positive 0.29% to 3.9870.
Oil prices fell on Wednesday as fears that more aggressive US interest rate hikes would pressure economic growth and oil demand outweighed a larger-than-expected draw in US crude stocks.
Spot Brent crude oil fell 0.38% to $82.35 per barrel. US West Texas Intermediate crude is down 0.49% to $76.34 a barrel.
The yellow metal gold is advance 0.11% to 1,820.65 dollars per ounce.
Market Wrap: Forex
The U.S. dollar edged lower in early European trade Thursday but remained elevated as Federal Reserve Chair Jerome Powell again pointed to further interest rate hikes to tackle inflation.
Today, the U.S. dollar index measures the Greenback against a trade-weighted basket of six major currencies, which surged 0.10% to 105.490.
The Euro US Dollar (EUR/USD) is a widely traded pair that is up 0.09% today. This left the pair trading around $1.05540.
The Japanese yen was negative against the U.S. dollar on Thursday. Today USD/JPY is slipped 0.66% to the 136.440 level.
Another commodity-related currency positive against the U.S dollar, AUD/USD gain 0.37% to 0.66100, and NZD/USD rose 0.25% to 0.61210 level.
EUR/USD Intraday: Support level at 1.05440
Our pivot point is at 1.05440
Preferable Price Action: Take long positions above pivot level with targets at 1.05840 & 1.06130 in extension.
Alternative Price Action: Below pivot looks for a further downside to 1.05090 & 1.04830.
Comment: RSI is above 50 levels and Pairs above 55MA.
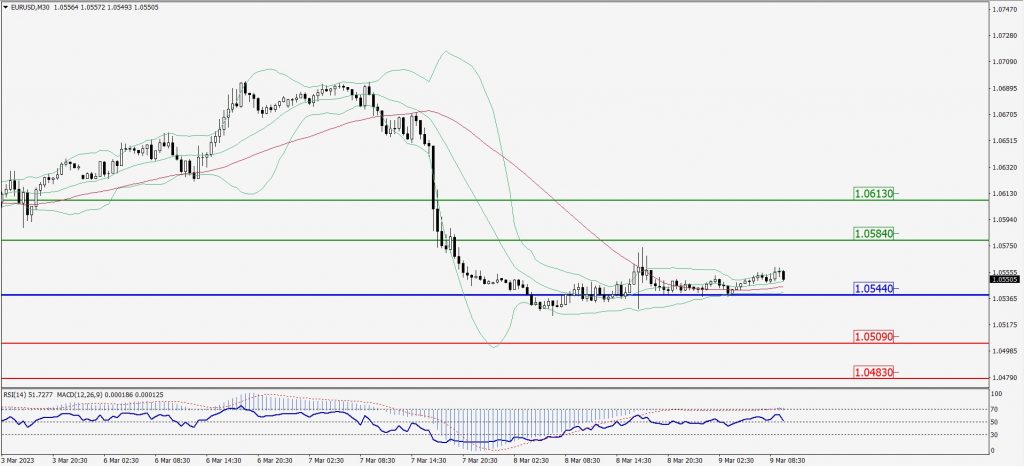
Green Lines Indicate Resistance Levels – Red Lines Indicate Support Levels
Light Blue is a Pivot Point – Black represents the price when the report was produced
GBP/USD Intraday: In a consolidation zone
Our pivot point is at 1.18410
Preferable Price Action: Buy positions above pivot with targets at 1.18910 & 1.19300 in extension.
Alternative Price Action: The price below pivot would call for further downside to 1.17930 & 1.17580.
Comment: RSI is at 50 levels and Pairs above 55MA.
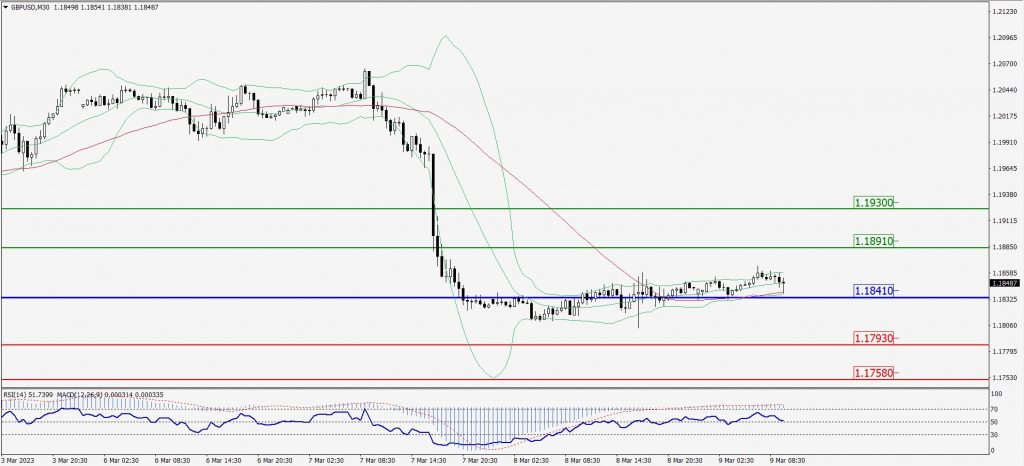
Green Lines Indicate Resistance Levels – Red Lines Indicate Support Levels
Light Blue is a Pivot Point – Black represents the price when the report was produced
USD/JPY Intraday: Trend on the downside
Our pivot point is at 136.900
Preferable Price Action: Sell position below pivot with the target at 136.360 and 135.990 in extension.
Alternative Price Action: The upside breakout of the pivot would call for 137.350 and 137.700.
Comment: MACD is below 50 level and Pairs below its 20MA & 55MA.
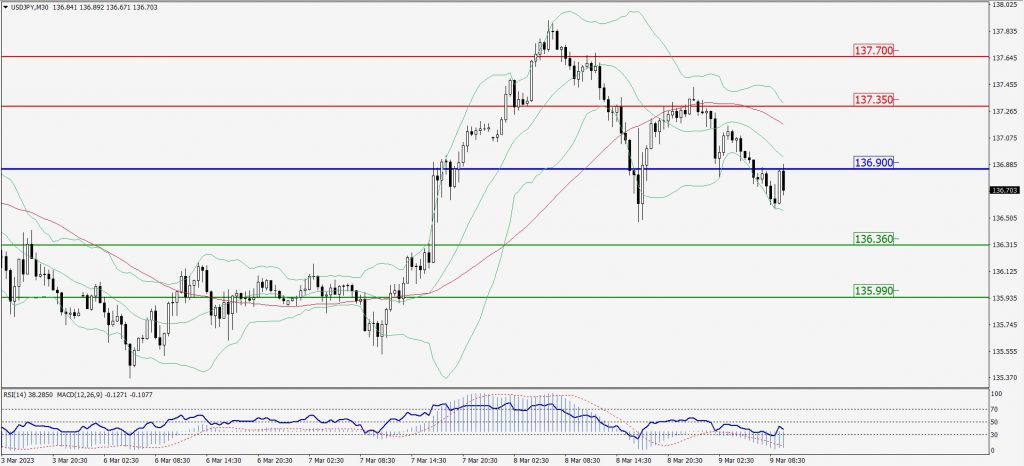
Green Lines Indicate Resistance Levels – Red Lines Indicate Support Levels
Light Blue is a Pivot Point – Black represents the price when the report was produced
AUD/USD Intraday: Trend on the upside
Our pivot point is at 0.65960
Preferable Price Action: Buy positions above pivot with targets at 0.66480 & 0.66810 in extension.
Alternative Price Action: Below pivot looks for a further upside with 0.65500 & 0.65190 as targets.
Comment: RSI is above 50 levels and pairs above its 20MA & 55MA.
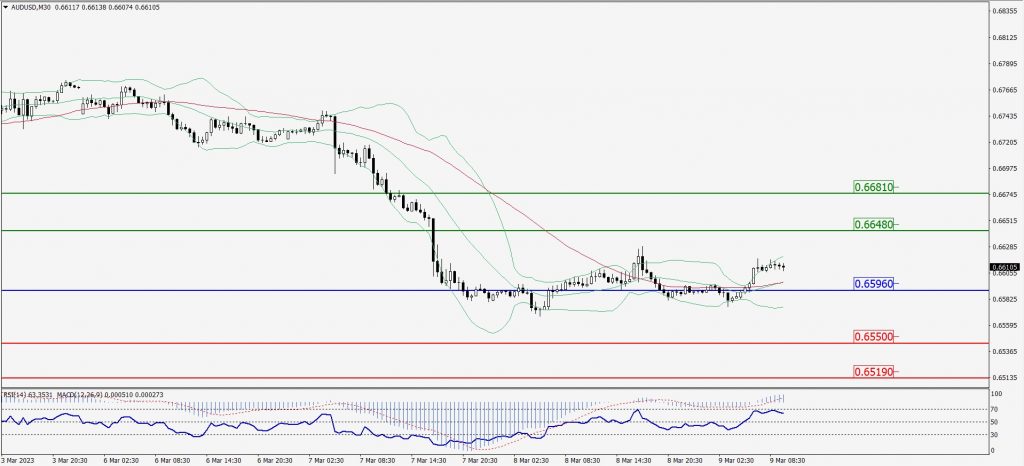
Green Lines Indicate Resistance Levels – Red Lines Indicate Support Levels
Light Blue is a Pivot Point – Black represents the price when the report was produced
CRUDEOIL Intraday: Trend on the upside
Our pivot point is at 76.66
Preferable Price Action: Above pivot buy oil with 77.55 & 78.17 as targets.
Alternative Price Action: Sell crude below pivot with targets at 75.90 and 75.34 in extension.
Comment: MACD is positive territory and Pairs above 20MA.
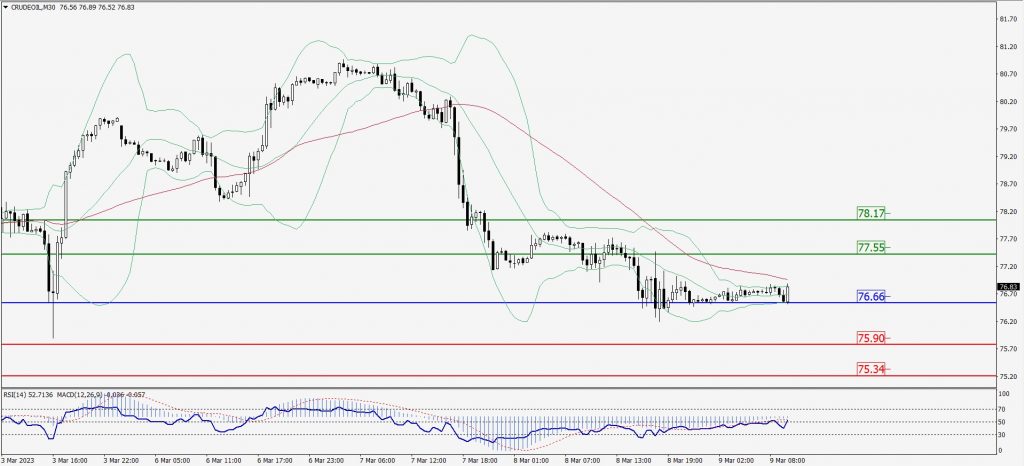
Green Lines Indicate Resistance Levels – Red Lines Indicate Support Levels
Light Blue is a Pivot Point – Black represents the price when the report was produced
XAU/USD Intraday: Trend on the upside
Our pivot point is 1813.30
Preferable Price Action: Further upside to 1821.50 and 1828.30
Alternative Price Action: If the price gives a downside breakout of a pivot, then the price extends to 1806.40 and 1800.80.
Comment: MACD is above 50 level and Pairs above 55MA.
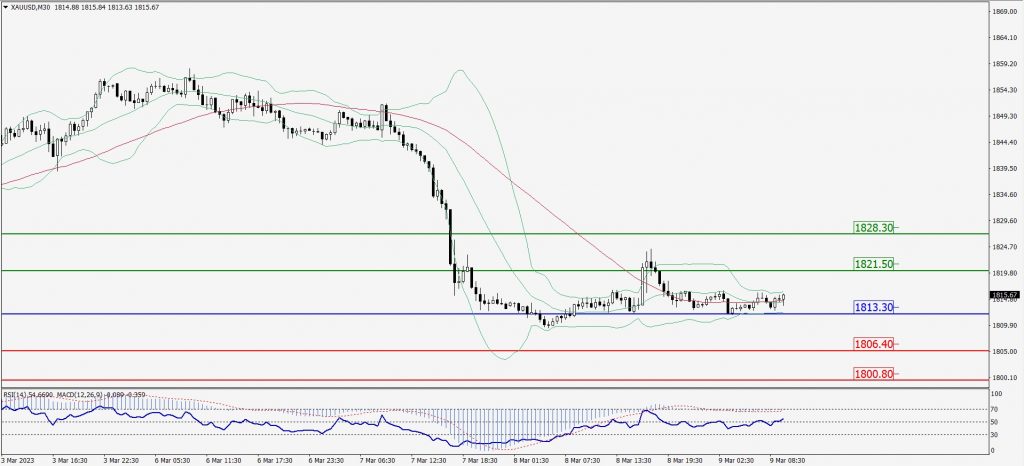
Green Lines Indicate Resistance Levels – Red Lines Indicate Support Levels
Light Blue is a Pivot Point – Black represents the price when the report was produced
Dow Jones Intraday: Trend on the downside
Our pivot point is 32,834.00
Preferable Price Action: Take sell positions below the pivot with targets at 32,652.00 & 32,534.00.
Alternative Price Action: Above 32,834.00 looks for further downside to 33,001.00 & 33,138.00.
Comment: RSI is below 50 levels and Pairs below its 20MA & 50MA.
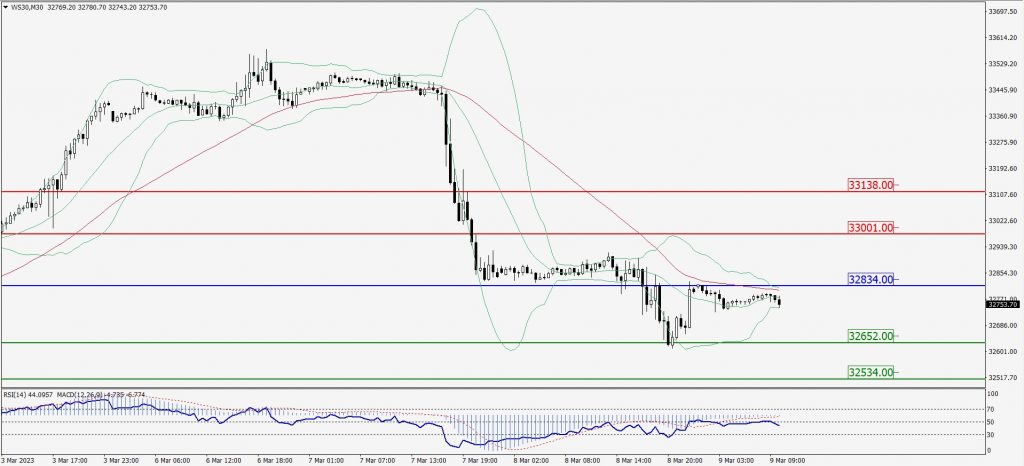
Green Lines Indicate Resistance Levels – Red Lines Indicate Support Levels
Light Blue is a Pivot Point – Black represents the price when the report was produced