Market Wrap: Stocks, Bonds, Commodities
Wall Street rallied on Friday to end a volatile week, as US Treasury yields eased and economic data helped investors look past the growing likelihood that the Federal Reserve will have to keep its restrictive policy in place until late in the year.
The Dow Jones Industrial Average rose 387.40 points to 33,390.97, the S&P 500 gain 1.61% to 4,045.64 and the Nasdaq Composite add 226.02 points to 11,689.01
MSCI’s index of Asia-Pacific stocks outside Japan is advance 0.61% to 645.12 levels. The Australian index was higher by 0.62% to 7,328.60. Japanese Nikkei Index rose 1.11% today.
European stocks were mixed on Monday, with the Stoxx Europe 50 Index gain 0.58% to 4,318.65, Germany’s DAX rose 0.33% to 15,630.55, and France’s CAC advance 0.61% to 7,392.80, and U.K.’s FTSE 100 subtract 0.13% to 7,936.25.
Benchmark 10-year U.S. Treasury fell as demand for safe assets ascend again, today 10-year bond yields are negative 0.87% to 3.9280.
Oil prices rose by more than $1 a barrel on Friday, recovering from an early slump after Reuters reported that the United Arab Emirates is not planning an exit from the Organization of Petroleum Exporting Countries.
Spot Brent crude oil fell 0.58% to $85.33 per barrel. US West Texas Intermediate crude is down 0.56% to $79.23 a barrel.
The yellow metal gold is advance 0.27% to 1,859.40 dollars per ounce.
Market Wrap: Forex
The U.S. dollar edged lower in early European trade Monday, with a testimony by Federal Reserve Chair Jerome Powell to U.S. Congress prompting caution at the start of the week.
Today, the U.S. dollar index measures the Greenback against a trade-weighted basket of six major currencies, which slipped 0.03% to 104.450.
The Euro US Dollar (EUR/USD) is a widely traded pair that is up 0.10% today. This left the pair trading around $1.06430.
The Japanese yen was negative against the U.S. dollar on Monday. Today USD/JPY is decline 0.02% to the 135.770 level.
Another commodity-related currency negative against the U.S dollar, AUD/USD lose 0.44% to 0.67380, and NZD/USD fell 0.55% to 0.61880 level.
EUR/USD Intraday: Trend on the upside
Our pivot point is at 1.06390
Preferable Price Action: Take long positions above pivot level with targets at 1.06800 & 1.07130 in extension.
Alternative Price Action: Below pivot looks for a further downside to 1.06010 & 1.05740.
Comment: RSI is above 50 levels and Pairs above its 20MA & 55MA.
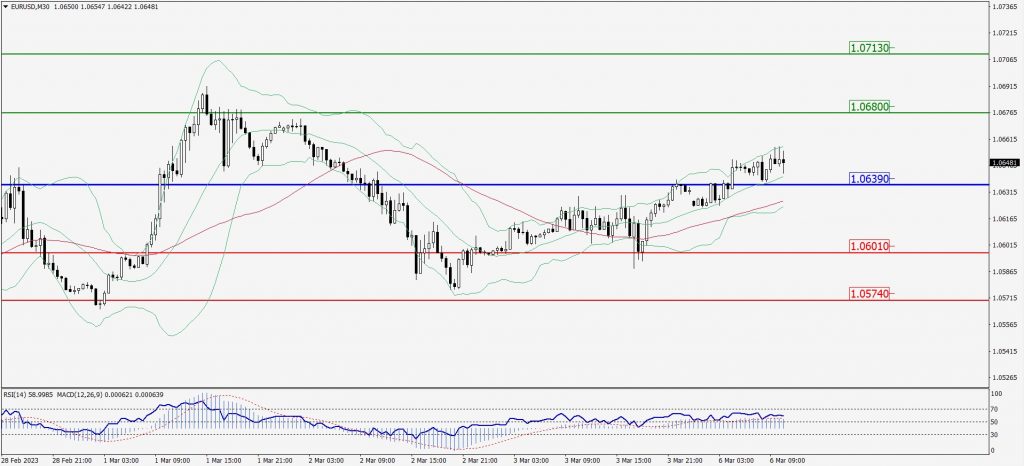
Green Lines Indicate Resistance Levels – Red Lines Indicate Support Levels
Light Blue is a Pivot Point – Black represents the price when the report was produced
GBP/USD Intraday: In a consolidation zone
Our pivot point is at 1.20210
Preferable Price Action: Buy positions above pivot with targets at 1.20570 & 1.20860 in extension.
Alternative Price Action: The price below pivot would call for further downside to 1.19890 & 1.19630.
Comment: RSI is at 50 levels and Pairs above 55MA.
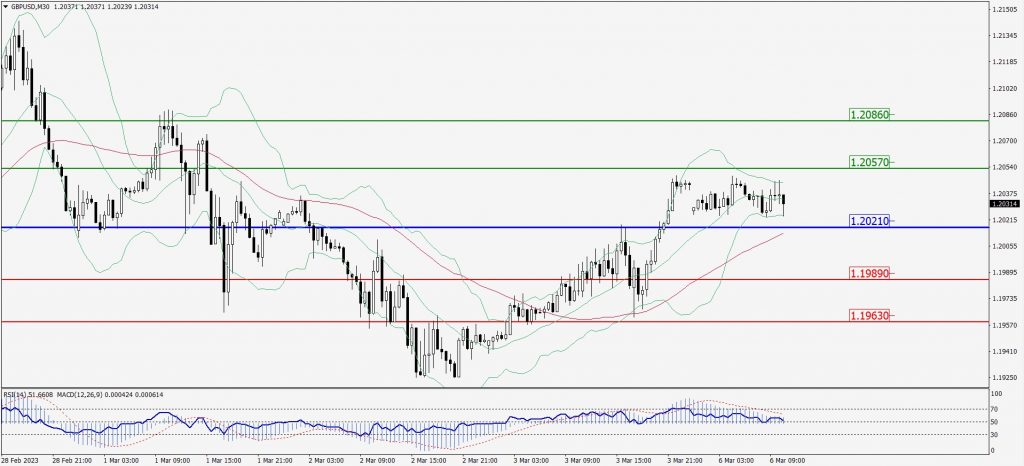
Green Lines Indicate Resistance Levels – Red Lines Indicate Support Levels
Light Blue is a Pivot Point – Black represents the price when the report was produced
USD/JPY Intraday: Trend on the upside
Our pivot point is at 135.810
Preferable Price Action: Buy position above pivot with the target at 136.140 and 136.400 in extension.
Alternative Price Action: The downside breakout of the pivot would call for 135.530 and 135.310.
Comment: MACD is above 50 level and Pairs above 20MA.
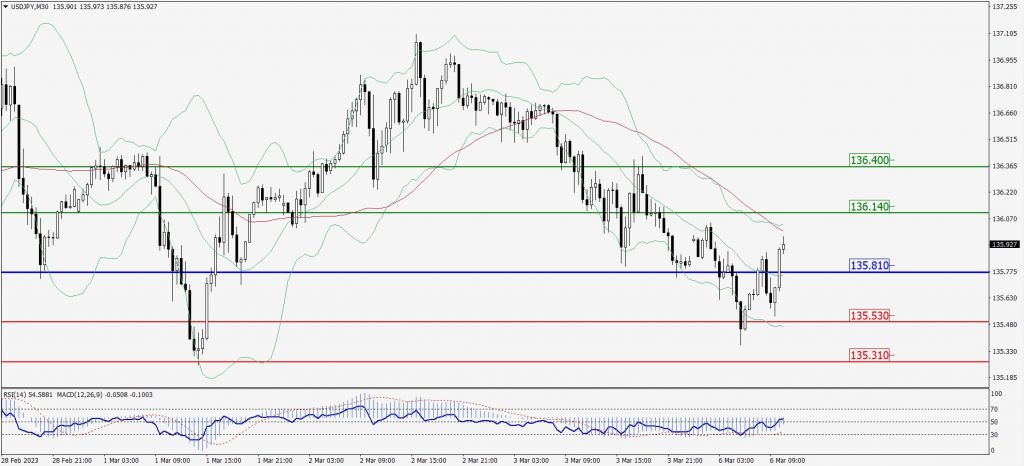
Green Lines Indicate Resistance Levels – Red Lines Indicate Support Levels
Light Blue is a Pivot Point – Black represents the price when the report was produced
AUD/USD Intraday: Major trend on the downside
Our pivot point is at 0.67480
Preferable Price Action: Sell positions below pivot with targets at 0.67310 & 0.67180 in extension.
Alternative Price Action: Above pivot looks for a further upside with 0.67640 & 0.67770 as targets.
Comment: RSI is below 50 levels and pairs below its 20MA & 55MA.
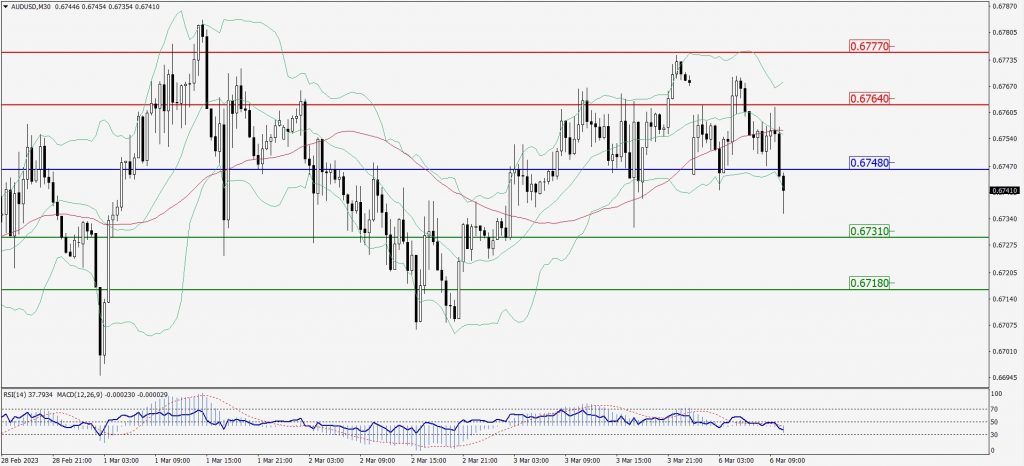
Green Lines Indicate Resistance Levels – Red Lines Indicate Support Levels
Light Blue is a Pivot Point – Black represents the price when the report was produced
CRUDEOIL Intraday: Trend on the upside
Our pivot point is at 79.28
Preferable Price Action: Above pivot buy oil with 80.33 & 81.12 as targets.
Alternative Price Action: Sell crude below pivot with targets at 78.37 and 77.68 in extension.
Comment: MACD is positive territory and Pairs above its 20MA & 55MA.
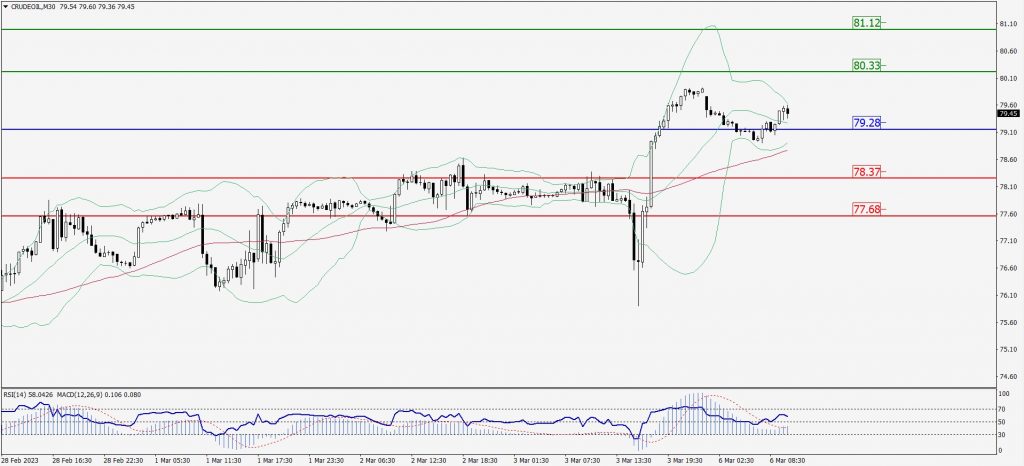
Green Lines Indicate Resistance Levels – Red Lines Indicate Support Levels
Light Blue is a Pivot Point – Black represents the price when the report was produced
XAU/USD Intraday: Support level at 1853.30
Our pivot point is 1853.30
Preferable Price Action: Further upside to 1866.10 and 1874.90
Alternative Price Action: If the price gives a downside breakout of a pivot, then the price extends to 1842.70 and 1833.40.
Comment: MACD is above 50 level and Pairs above its 20MA & 55MA.
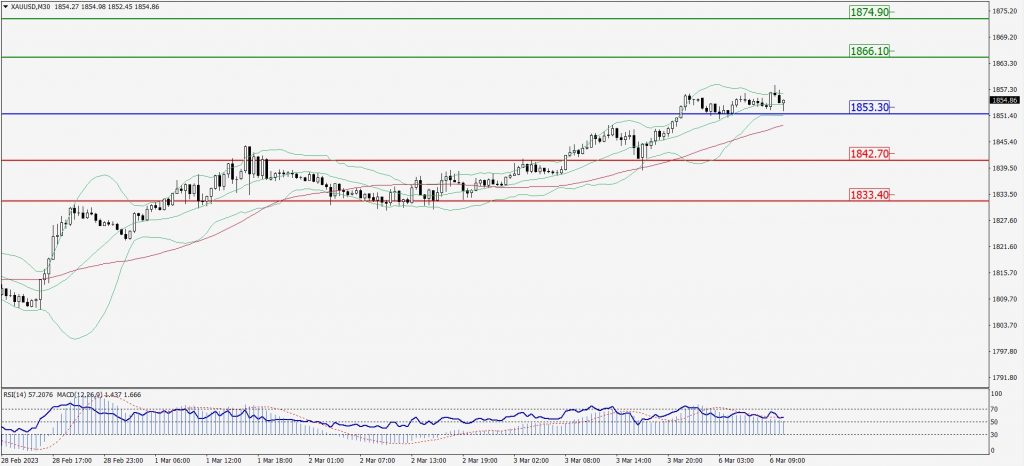
Green Lines Indicate Resistance Levels – Red Lines Indicate Support Levels
Light Blue is a Pivot Point – Black represents the price when the report was produced
Dow Jones Intraday: Major trend on the upside
Our pivot point is 33,343.00
Preferable Price Action: Take buy positions above the pivot with targets at 33,605.00 & 33,780.00.
Alternative Price Action: Below 33,343.00 looks for further upside to 33,106.00 & 32,931.00.
Comment: RSI is above 50 levels and Pairs above its 20MA & 50MA.
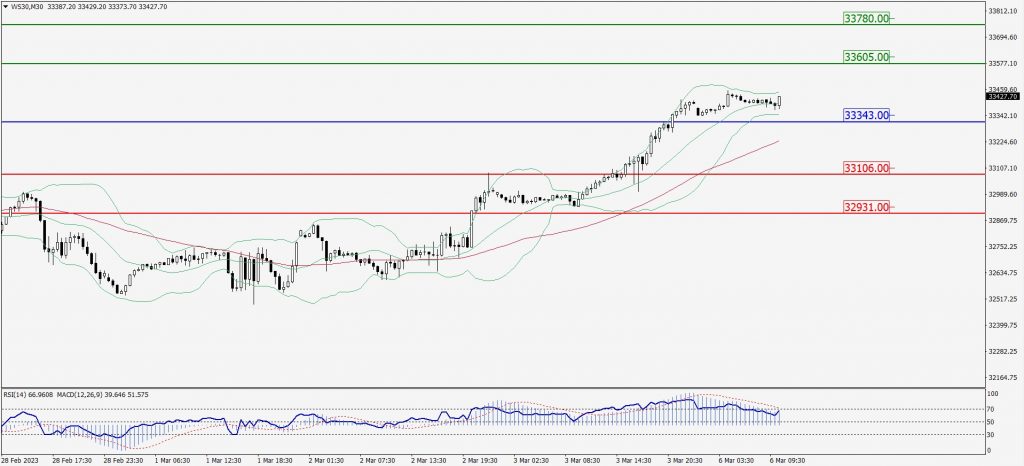
Green Lines Indicate Resistance Levels – Red Lines Indicate Support Levels
Light Blue is a Pivot Point – Black represents the price when the report was produced