Market Wrap: Stocks, Bonds, Commodities
The S&P 500 and Nasdaq fell for a second straight session on Wednesday as Treasury yields jumped after manufacturing data indicated inflation is likely to remain stubbornly high, while comments from Federal Reserve policymakers supported a hawkish policy stance.
The Dow Jones Industrial Average rose 5.14 points to 32,661.84, the S&P 500 lose 0.47% to 3,951.39 and the Nasdaq Composite subtract 76.06 points to 11,379.48
MSCI’s index of Asia-Pacific stocks outside Japan is decline 0.37% to 635.70 levels. The Australian index was higher by 0.05% to 7,255.40. Japanese Nikkei Index fell 0.06% today.
European stocks were negative on Thursday, with the Stoxx Europe 50 Index lose 0.65% to 4,188.45, Germany’s DAX fell 0.39% to 15,305.02, and France’s CAC decline 0.03% to 7,232.30, and U.K.’s FTSE 100 subtract 0.37% to 7,885.35.
Benchmark 10-year U.S. Treasury fell as demand for safe assets ascend again, today 10-year bond yields are positive 1.05% to 4.0380.
Oil prices settled up slightly on Wednesday as signs of ample supply, including growing US crude inventories, offset growing hopes for higher demand after a jump in manufacturing in top crude importer China.
Spot Brent crude oil fell 0.31% to $84.05 per barrel. US West Texas Intermediate crude is down 0.37% to $77.40 a barrel.
The yellow metal gold is decline 0.42% to 1,837.65 dollars per ounce.
Market Wrap: Forex
European stock markets are expected to open in a cautious manner Thursday ahead of the release of the latest Eurozone inflation data, which will provide clues about the future path of interest rates in the region.
Today, the U.S. dollar index measures the Greenback against a trade-weighted basket of six major currencies, which surge 0.27% to 104.718.
The Euro US Dollar (EUR/USD) is a widely traded pair that is down 0.27% today. This left the pair trading around $1.06360.
The Japanese yen was positive against the U.S. dollar on Thursday. Today USD/JPY is advance 0.44% to the 136.760 level.
Another commodity-related currency negative against the U.S dollar, AUD/USD lose 0.45% to 0.67310, and NZD/USD fell 0.69% to 0.62200 level.
EUR/USD Intraday: Resistance level at 1.06490
Our pivot point is at 1.06490
Preferable Price Action: Take short positions below pivot level with targets at 1.06240 & 1.06060 in extension.
Alternative Price Action: Above pivot looks for a further upside to 1.06740 & 1.06920.
Comment: RSI is below 50 levels and Pairs below its 20MA & 55MA.
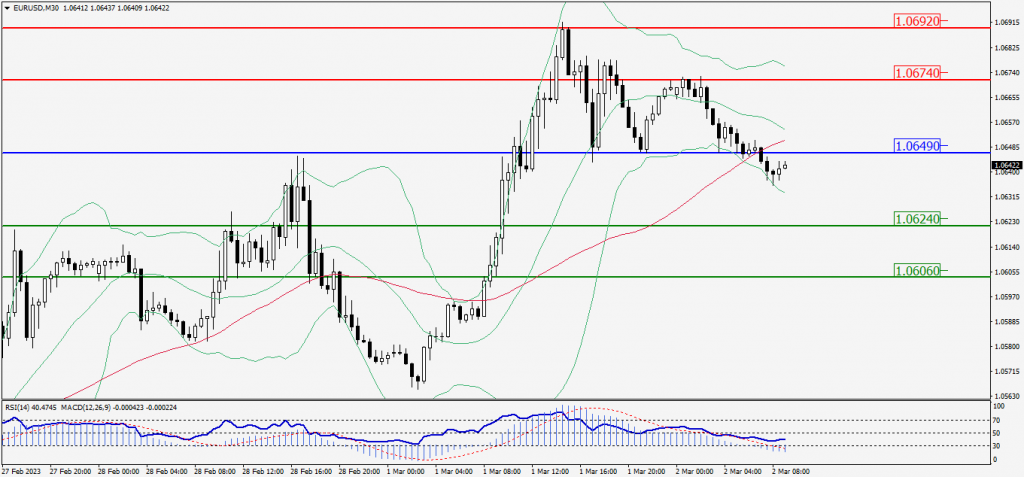
Green Lines Indicate Resistance Levels – Red Lines Indicate Support Levels
Light Blue is a Pivot Point – Black represents the price when the report was produced
GBP/USD Intraday: Major trend on the downside
Our pivot point is at 1.20080
Preferable Price Action: Sell positions below pivot with targets at 1.19430 & 1.18950 in extension.
Alternative Price Action: The price above pivot would call for further upside to 1.20710 & 1.21200.
Comment: RSI is below 50 levels and Pairs below its 20MA & 55MA.
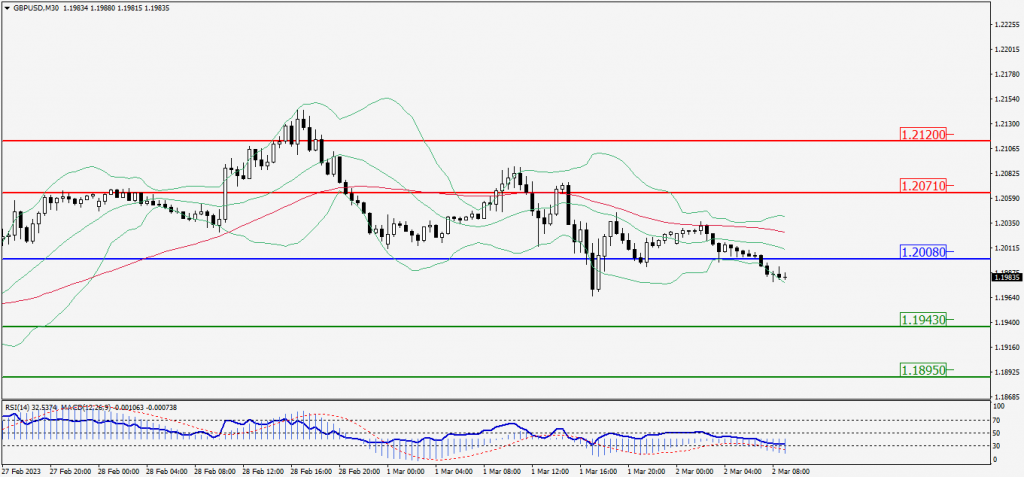
Green Lines Indicate Resistance Levels – Red Lines Indicate Support Levels
Light Blue is a Pivot Point – Black represents the price when the report was produced
USD/JPY Intraday: Major trend on the upside
Our pivot point is at 136.590
Preferable Price Action: Buy position above pivot with the target at 137.050 and 137.390 in extension.
Alternative Price Action: The downside breakout of the pivot would call for 136.130 and 135.780.
Comment: MACD is above 50 level and Pairs above its 20MA & 55MA.
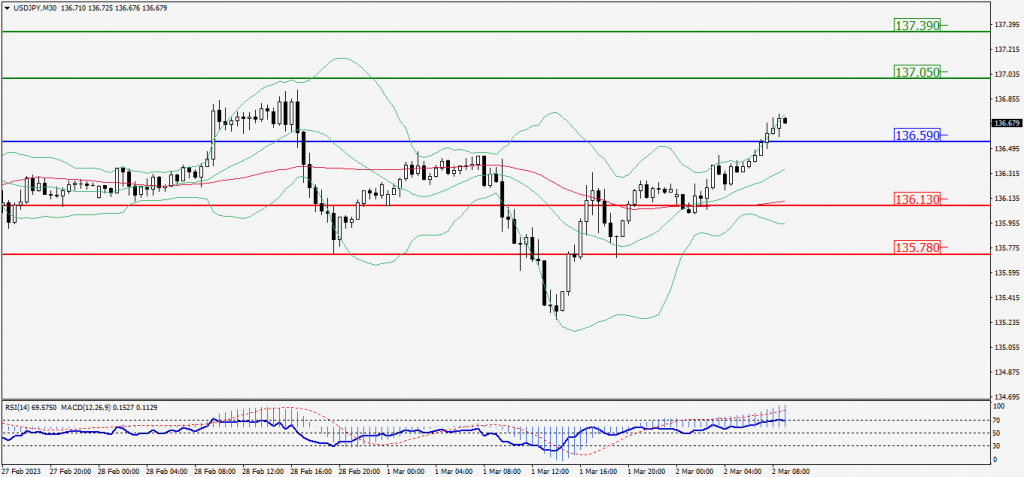
Green Lines Indicate Resistance Levels – Red Lines Indicate Support Levels
Light Blue is a Pivot Point – Black represents the price when the report was produced
AUD/USD Intraday: Trend on the downside
Our pivot point is at 0.67370
Preferable Price Action: Sell positions below pivot with targets at 0.67210 & 0.67080 in extension.
Alternative Price Action: Above pivot looks for a further upside with 0.67530 & 0.67660 as targets.
Comment: RSI is below 50 levels and pairs below its 20MA & 55MA.
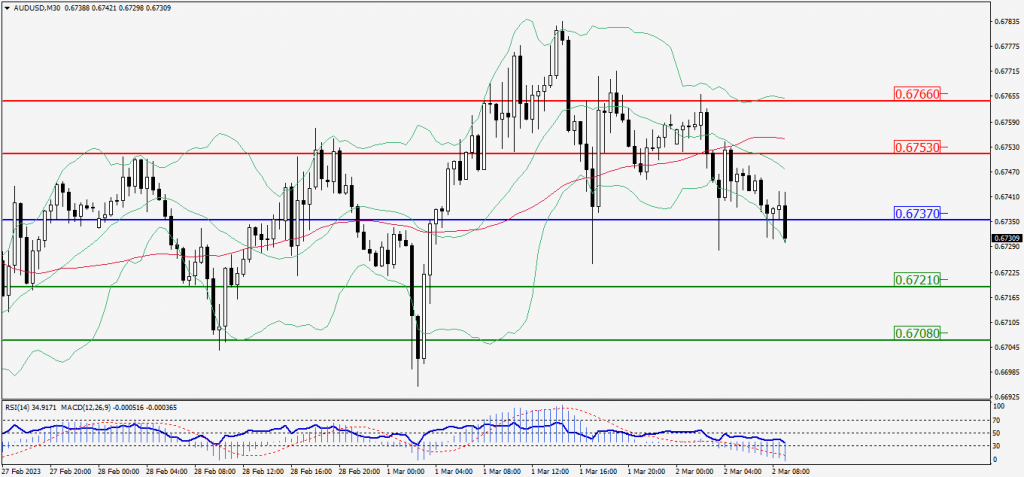
Green Lines Indicate Resistance Levels – Red Lines Indicate Support Levels
Light Blue is a Pivot Point – Black represents the price when the report was produced
CRUDEOIL Intraday: In a consolidation zone
Our pivot point is at 77.89
Preferable Price Action: Below pivot sell oil with 76.76 & 75.91 as targets.
Alternative Price Action: Buy crude above pivot with targets at 79.01 and 79.82 in extension.
Comment: MACD is flat territory and Pairs below 20MA.
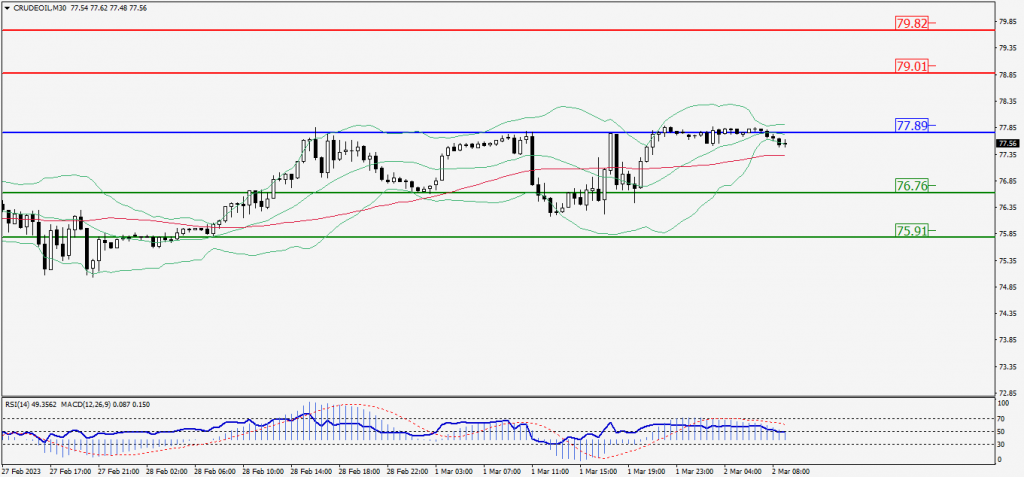
Green Lines Indicate Resistance Levels – Red Lines Indicate Support Levels
Light Blue is a Pivot Point – Black represents the price when the report was produced
XAU/USD Intraday: Trend on the downside
Our pivot point is 1834.50
Preferable Price Action: Further downside to 1824.20 and 1816.30
Alternative Price Action: If the price gives an upside breakout of a pivot, then the price extends to 1845.20 and 1852.80.
Comment: MACD is below 50 level and Pairs below its 20MA & 55MA.
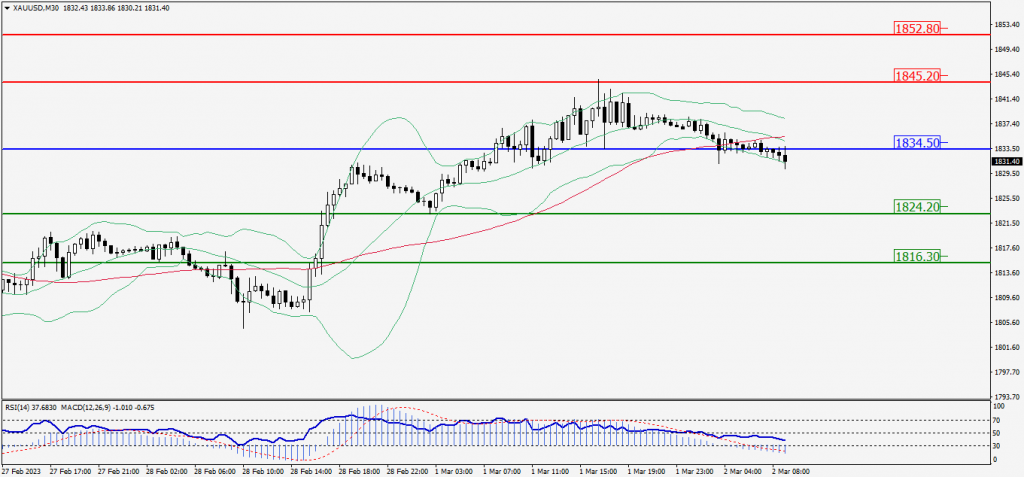
Green Lines Indicate Resistance Levels – Red Lines Indicate Support Levels
Light Blue is a Pivot Point – Black represents the price when the report was produced
Dow Jones Intraday: Resistance level at 32,714.00
Our pivot point is 32,714.00
Preferable Price Action: Take sell positions below the pivot with targets at 32,557.00 & 32,427.00.
Alternative Price Action: Above 32,714.00 looks for further upside to 32,868.00 & 32,995.00.
Comment: RSI is below 50 levels and Pairs below its 20MA & 55MA.
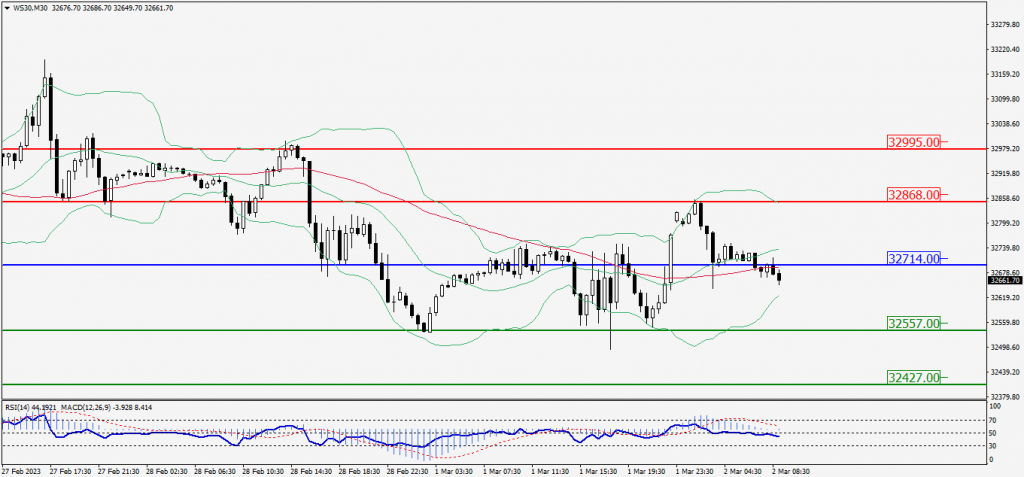
Green Lines Indicate Resistance Levels – Red Lines Indicate Support Levels
Light Blue is a Pivot Point – Black represents the price when the report was produced