Market Wrap: Stocks, Bonds, Commodities
US stocks eked out a slight gain on Monday as investors engaged in some bargain hunting after last week’s losses, the biggest percentage declines of 2023 for Wall Street’s main benchmarks, as jitters persisted about coming interest rate hikes to tame stubbornly high inflation.
The Dow Jones Industrial Average rose 72.17 points to 32,889.09, the S&P 500 gain 0.31% to 3,982.24 and the Nasdaq Composite add 72.04 points to 11,466.98
MSCI’s index of Asia-Pacific stocks outside Japan is decline 0.46% to 623.56 levels. The Australian index was higher by 0.47% to 7,258.40. Japanese Nikkei Index rose 0.08% today.
European stocks were positive on Tuesday, with the Stoxx Europe 50 Index gain 1.66% to 4,248.01, Germany’s DAX rose 1.13% to 15,381.43, and France’s CAC advance 1.51% to 7,295.55, and U.K.’s FTSE 100 add 0.72% to 7,935.11.
Benchmark 10-year U.S. Treasury fell as demand for safe assets ascend again, today 10-year bond yields are positive 0.25% to 3.9320.
Oil prices slid about 1 percent on Monday as strong US economic data had investors bracing for more interest rate hikes from the US Federal Reserve to fight inflation, which could slow economic growth and oil demand.
Spot Brent crude oil rose 0.79% to $82.69 per barrel. US West Texas Intermediate crude is up 0.90% to $76.36 a barrel.
The yellow metal gold is decline 0.35% to 1,818.45 dollars per ounce.
Market Wrap: Forex
European stock markets are expected to open marginally lower Tuesday in cautious trading as investors digest the new trade deal between the U.K. and the European Union ahead of the release of key regional inflation data.
Today, the U.S. dollar index measures the Greenback against a trade-weighted basket of six major currencies, which surge 0.15% to 104.780.
The Euro US Dollar (EUR/USD) is a widely traded pair that is down 0.15% today. This left the pair trading around $1.05910.
The Japanese yen was positive against the U.S. dollar on Tuesday. Today USD/JPY is advance 0.15% to the 136.410 level.
Another commodity-related currency negative against the U.S dollar, AUD/USD lose 0.17% to 0.67230, and NZD/USD fell 0.30% to 0.61480 level.
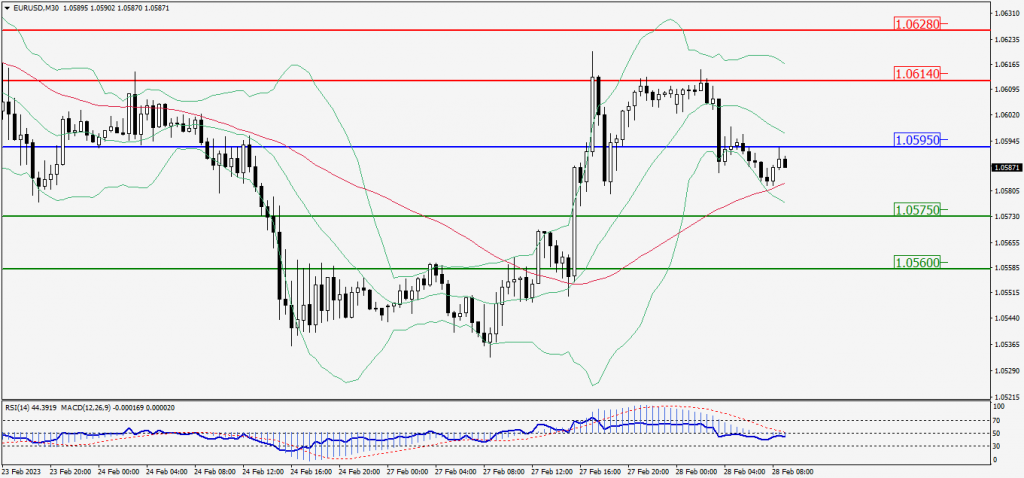
EUR/USD Intraday: Resistance level at 1.05950
Our pivot point is at 1.05950
Preferable Price Action: Take short positions below pivot level with targets at 1.05750 & 1.05600 in extension.
Alternative Price Action: Above pivot looks for a further upside to 1.06140 & 1.06280.
Comment: RSI is below 50 levels and Pairs below 20MA.
Green Lines Indicate Resistance Levels – Red Lines Indicate Support Levels
Light Blue is a Pivot Point – Black represents the price when the report was produced
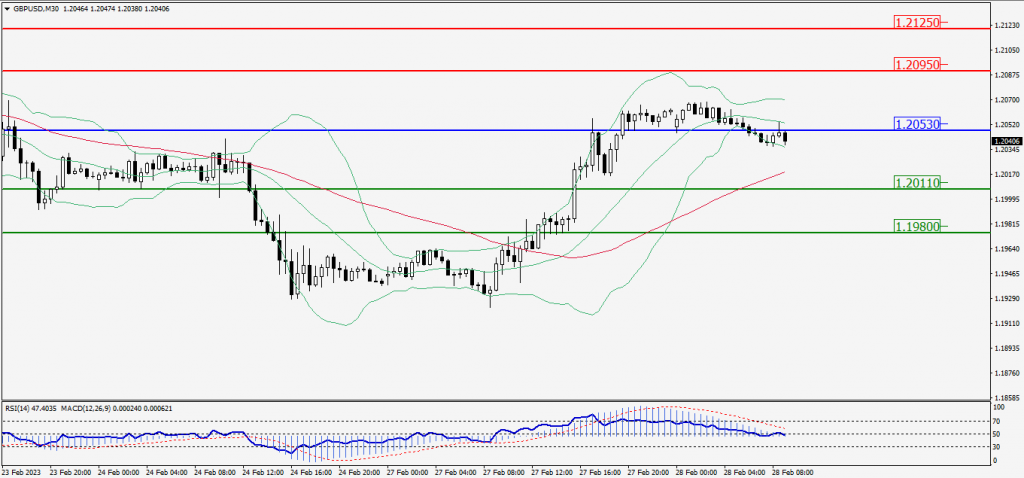
GBP/USD Intraday: In a consolidation zone
Our pivot point is at 1.20530
Preferable Price Action: Sell positions below pivot with targets at 1.20110 & 1.19800 in extension.
Alternative Price Action: The price above pivot would call for further upside to 1.20950 & 1.21250.
Comment: RSI is at 50 levels and Pairs below 20MA.
Green Lines Indicate Resistance Levels – Red Lines Indicate Support Levels
Light Blue is a Pivot Point – Black represents the price when the report was produced
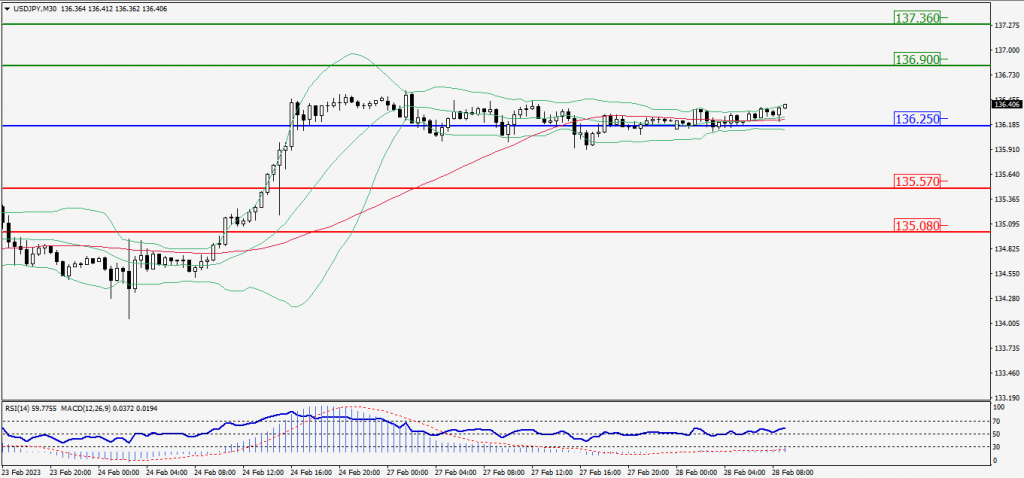
USD/JPY Intraday: Support level at 136.250
Our pivot point is at 136.250
Preferable Price Action: Buy position above pivot with the target at 136.900 and 137.360 in extension.
Alternative Price Action: The downside breakout of the pivot would call for 135.570 and 135.080.
Comment: MACD is above 50 level and Pairs above its 20MA & 55MA.
Green Lines Indicate Resistance Levels – Red Lines Indicate Support Levels
Light Blue is a Pivot Point – Black represents the price when the report was produced
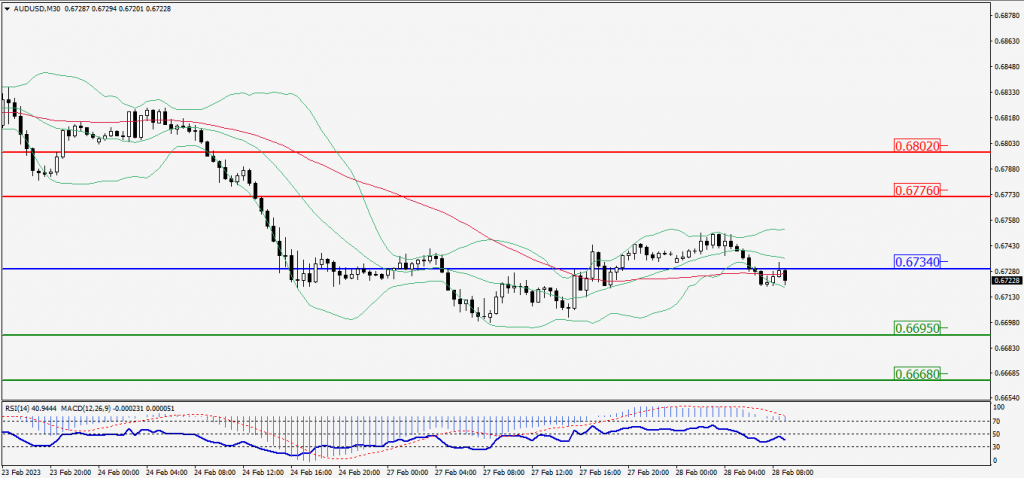
AUD/USD Intraday: Resistance level at 0.67340
Our pivot point is at 0.67340
Preferable Price Action: Sell positions below pivot with targets at 0.66950 & 0.66680 in extension.
Alternative Price Action: Above pivot looks for a further upside with 0.67760 & 0.68020 as targets.
Comment: RSI is below 50 levels and pairs below 20MA.
Green Lines Indicate Resistance Levels – Red Lines Indicate Support Levels
Light Blue is a Pivot Point – Black represents the price when the report was produced
CRUDEOIL Intraday: Trend on the upside
Our pivot point is at 76.25
Preferable Price Action: Above pivot buy oil with 76.94 & 77.36 as targets.
Alternative Price Action: Sell crude below pivot with targets at 75.59 and 75.14 in extension.
Comment: MACD is positive territory and Pairs above its 20MA & 55MA.
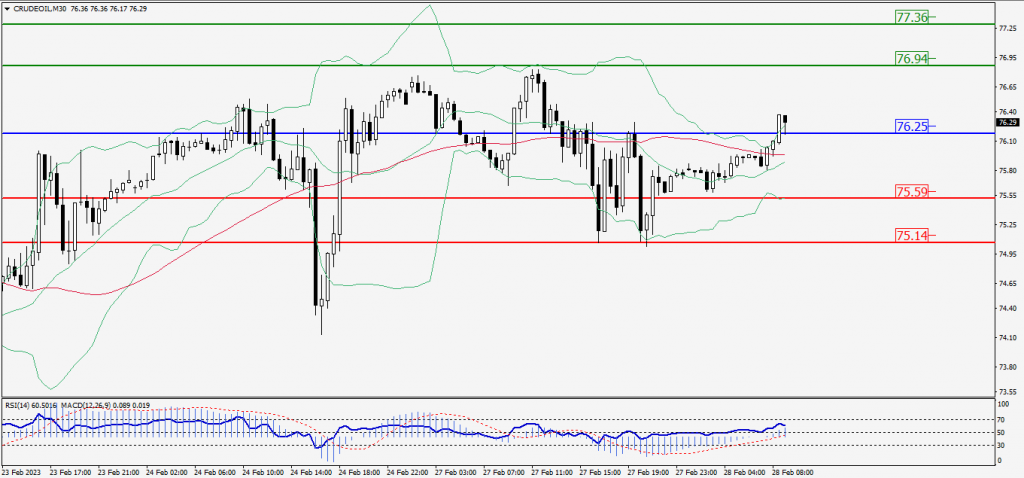
Green Lines Indicate Resistance Levels – Red Lines Indicate Support Levels
Light Blue is a Pivot Point – Black represents the price when the report was produced
XAU/USD Intraday: Trend on the downside
Our pivot point is 1813.40
Preferable Price Action: Further downside to 1808.80 and 1805.50
Alternative Price Action: If the price gives an upside breakout of a pivot, then the price extends to 1818.10 and 1821.50.
Comment: MACD is below 50 level and Pairs below 20MA.
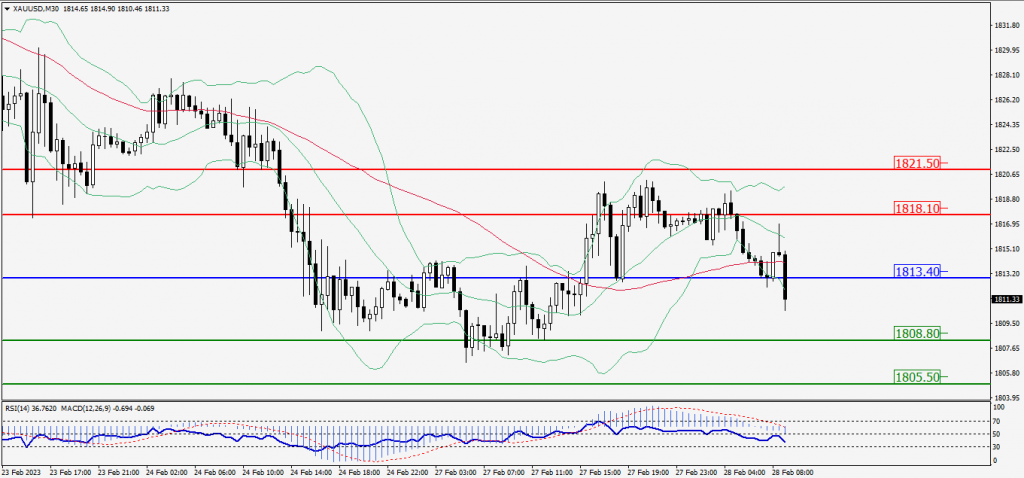
Green Lines Indicate Resistance Levels – Red Lines Indicate Support Levels
Light Blue is a Pivot Point – Black represents the price when the report was produced
Dow Jones Intraday: Trend on the downside
Our pivot point is 32,910.00
Preferable Price Action: Take sell positions below the pivot with targets at 32,793.00 & 32,703.00.
Alternative Price Action: Above 32,910.00 looks for further upside to 33,034.00 & 33,117.00.
Comment: RSI is below 50 levels and Pairs below its 20MA & 55MA.
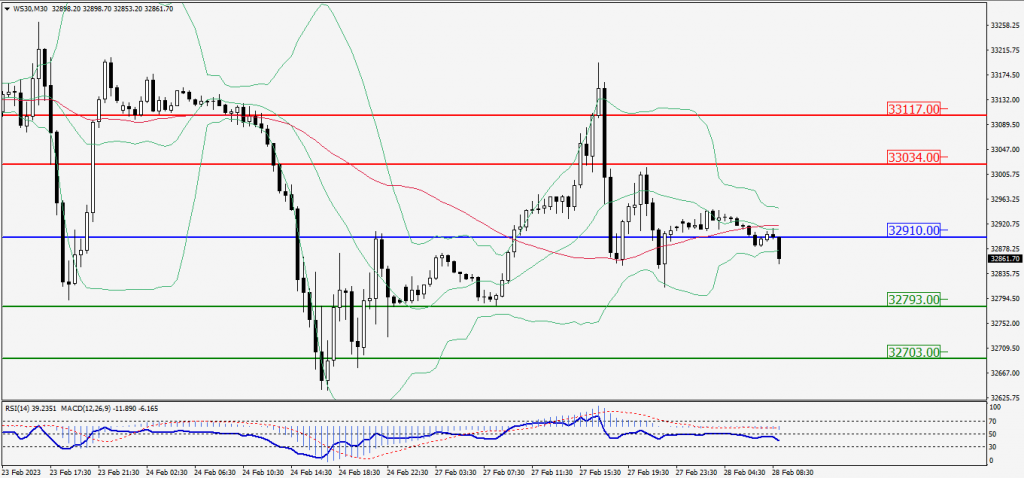
Green Lines Indicate Resistance Levels – Red Lines Indicate Support Levels
Light Blue is a Pivot Point – Black represents the price when the report was produced