Market Wrap: Stocks, Bonds, Commodities
Wall Street’s main indices posted their biggest weekly drop of 2023 after sharp losses on Friday, as investors braced for the possibility of more aggressive rate hikes from the US Federal Reserve as US economic data pointed to resilient consumers.
The Dow Jones Industrial Average fell 336.99 points to 32,816.92, the S&P 500 lose 1.05% to 3,970.04 and the Nasdaq Composite subtract 195.46 points to 11,394.94
MSCI’s index of Asia-Pacific stocks outside Japan is decline 0.83% to 624.88 levels. The Australian index was lower by 1.12% to 7,224.80. Japanese Nikkei Index fell 0.11% today.
European stocks were negative on Monday, with the Stoxx Europe 50 Index lose 1.86% to 4,178.82, Germany’s DAX fell 1.72% to 15,209.74, and France’s CAC decline 1.78% to 7,187.27, and U.K.’s FTSE 100 subtract 0.37% to 7,878.66.
Benchmark 10-year U.S. Treasury fell as demand for safe assets ascend again, today 10-year bond yields are negative 0.29% to 3.9380.
Oil prices fell below $82 a barrel on February 24 as rising inventories in the United States and concerns over global economic activity offset the prospect of lower Russian exports.
Spot Brent crude oil fell 0.78% to $82.17 per barrel. US West Texas Intermediate crude is down 0.68% to $75.80 a barrel.
The yellow metal gold is decline 0.06% to 1,815.95 dollars per ounce.
Market Wrap: Forex
European stock markets are expected to open in a subdued manner Monday, as investors await regional inflation data to provide clues on the near-term path of interest rates.
Today, the U.S. dollar index measures the Greenback against a trade-weighted basket of six major currencies, which surge 0.01% to 105.168.
The Euro US Dollar (EUR/USD) is a widely traded pair that is up 0.02% today. This left the pair trading around $1.05490.
The Japanese yen was negative against the U.S. dollar on Monday. Today USD/JPY is decline 0.16% to the 136.240 level.
Another commodity-related currency negative against the U.S dollar, AUD/USD lose 0.19% to 0.67120, and NZD/USD fell 0.24% to 0.61450 level.
EUR/USD Intraday: Trend on the downside
Our pivot point is at 1.05530
Preferable Price Action: Take short positions below pivot level with targets at 1.04970 & 1.04610 in extension.
Alternative Price Action: Above pivot looks for a further upside to 1.06090 & 1.06460.
Comment: RSI is below 50 levels and Pairs below its 20MA & 55MA.
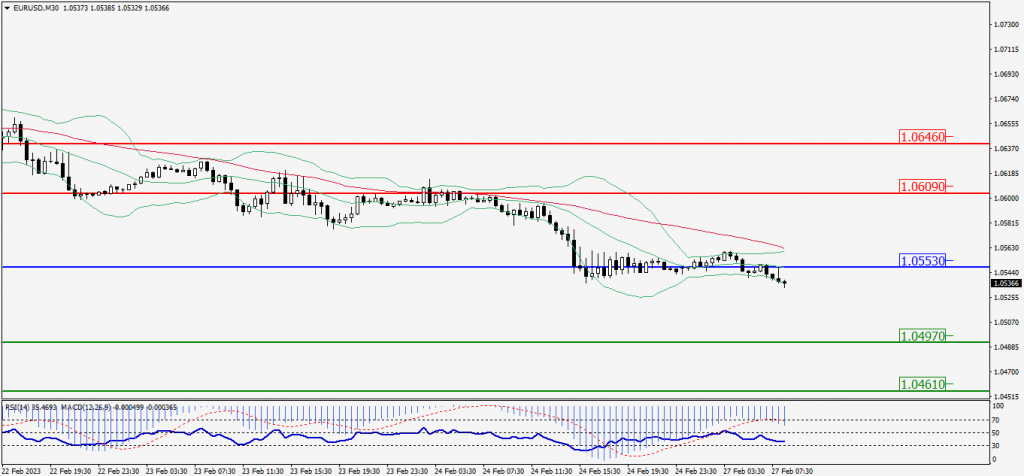
Green Lines Indicate Resistance Levels – Red Lines Indicate Support Levels
Light Blue is a Pivot Point – Black represents the price when the report was produced
GBP/USD Intraday: Resistance level at 1.19560
Our pivot point is at 1.19560
Preferable Price Action: Sell positions below pivot with targets at 1.18880 & 1.18460 in extension.
Alternative Price Action: The price above pivot would call for further upside to 1.20240 & 1.20670.
Comment: RSI is below 50 levels and Pairs below its 20MA & 55MA.
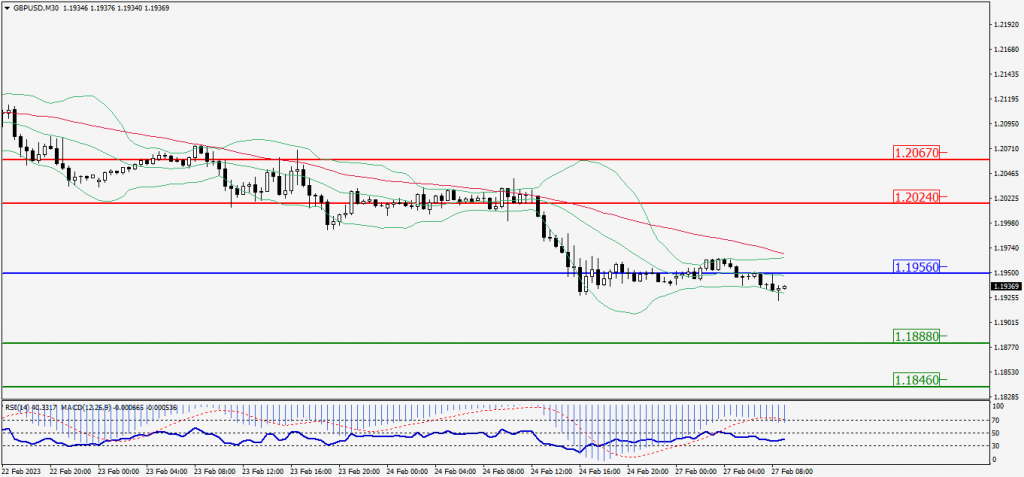
Green Lines Indicate Resistance Levels – Red Lines Indicate Support Levels
Light Blue is a Pivot Point – Black represents the price when the report was produced
USD/JPY Intraday: Support level at 136.210
Our pivot point is at 136.210
Preferable Price Action: Buy position above pivot with the target at 137.130 and 137.790 in extension.
Alternative Price Action: The downside breakout of the pivot would call for 135.260 and 134.570.
Comment: MACD is above 50 level and Pairs above 55MA.
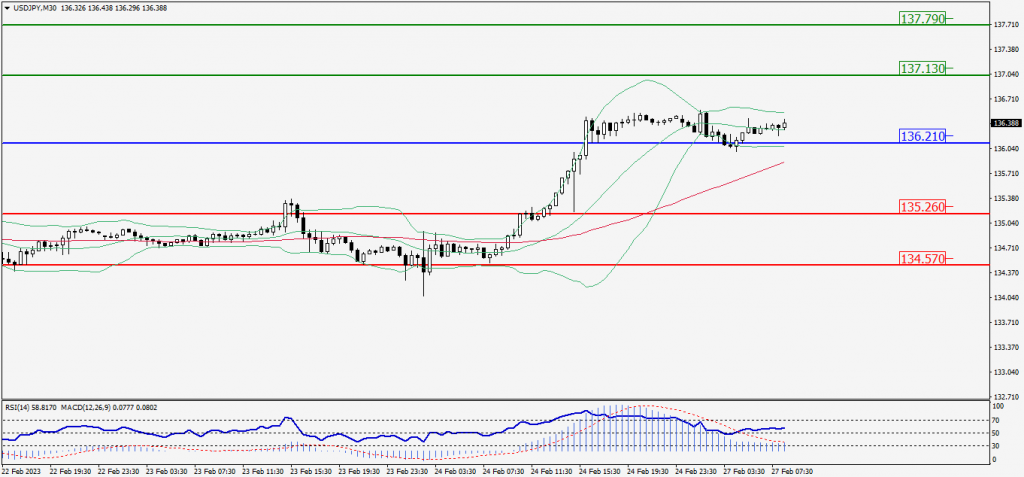
Green Lines Indicate Resistance Levels – Red Lines Indicate Support Levels
Light Blue is a Pivot Point – Black represents the price when the report was produced
AUD/USD Intraday: Major trend on the downside
Our pivot point is at 0.67220
Preferable Price Action: Sell positions below pivot with targets at 0.66590 & 0.66190 in extension.
Alternative Price Action: Above pivot looks for a further upside with 0.67790 & 0.68200 as targets.
Comment: RSI is below 50 levels and pairs below its 20MA & 55MA.
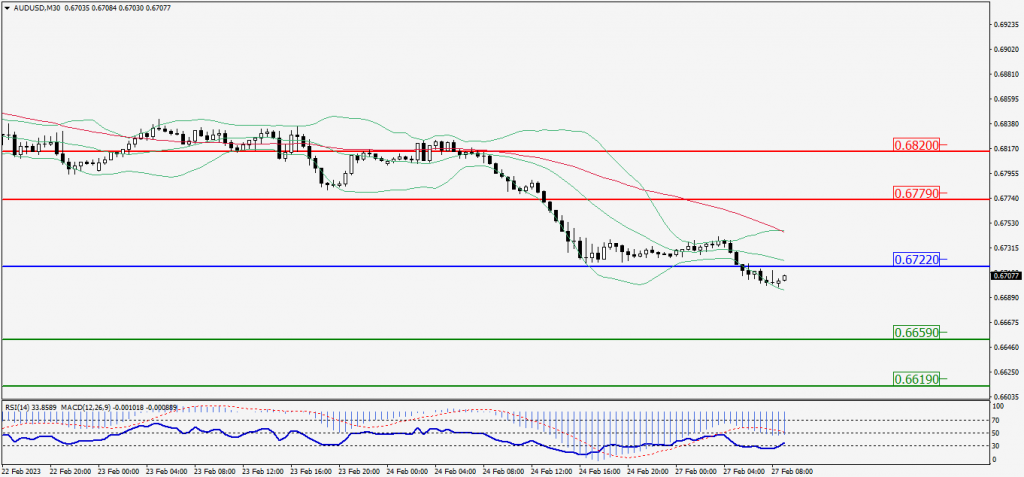
Green Lines Indicate Resistance Levels – Red Lines Indicate Support Levels
Light Blue is a Pivot Point – Black represents the price when the report was produced
CRUDEOIL Intraday: Resistance level at 76.06
Our pivot point is at 76.06
Preferable Price Action: Below pivot sell oil with 75.38 & 74.87 as targets.
Alternative Price Action: Buy crude above pivot with targets at 75.38 and 74.87 in extension.
Comment: MACD is negative territory and Pairs below its 20MA & 55MA.
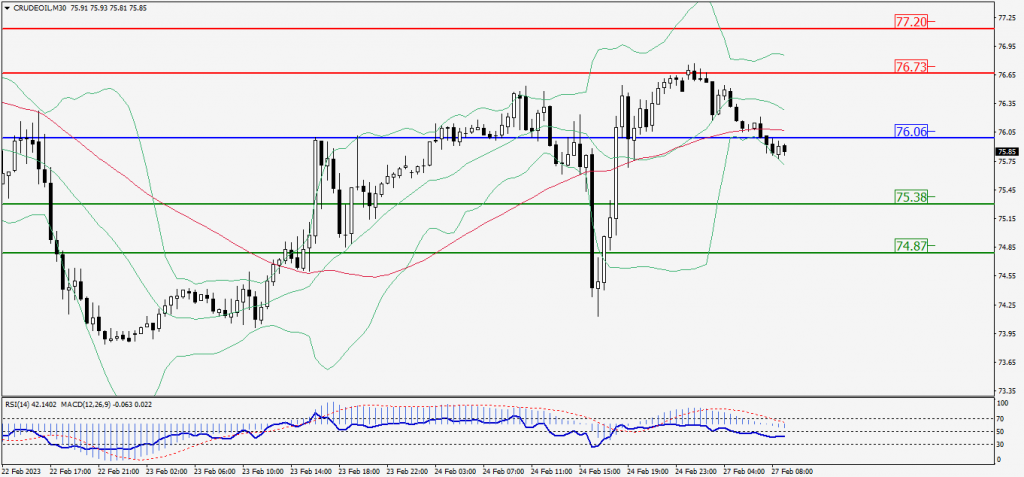
Green Lines Indicate Resistance Levels – Red Lines Indicate Support Levels
Light Blue is a Pivot Point – Black represents the price when the report was produced
XAU/USD Intraday: Trend on the downside
Our pivot point is 1813.30
Preferable Price Action: Further downside to 1799.30 and 1789.90
Alternative Price Action: If the price gives an upside breakout of a pivot, then the price extends to 1828.80 and 1838.80.
Comment: MACD is below 50 level and Pairs below its 20MA & 55MA .
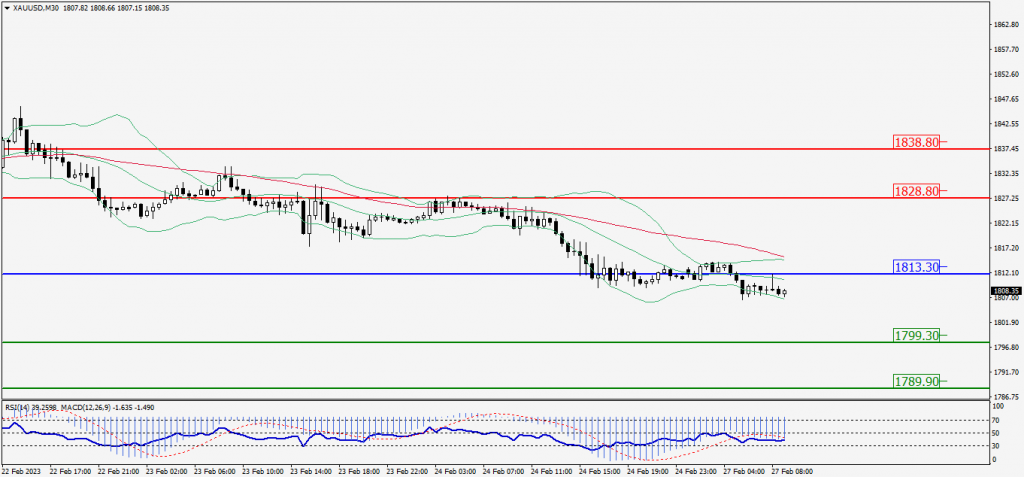
Green Lines Indicate Resistance Levels – Red Lines Indicate Support Levels
Light Blue is a Pivot Point – Black represents the price when the report was produced
Dow Jones Intraday: In a consolidation zone
Our pivot point is 32,862.00
Preferable Price Action: Take sell positions below the pivot with targets at 32,745.00 & 32,667.00.
Alternative Price Action: Above 32,862.00 looks for further upside to 32,975.00 & 33,052.00.
Comment: RSI is at 50 levels and Pairs below 55MA.
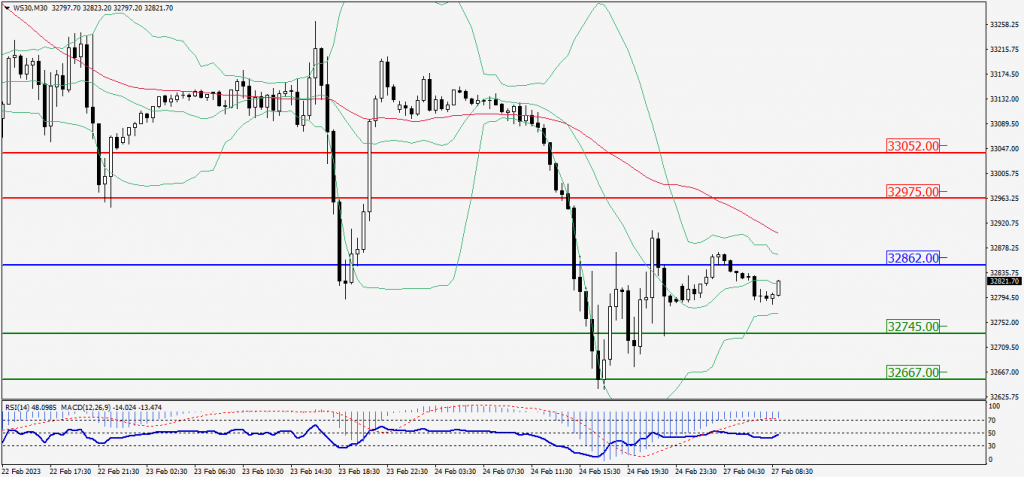
Green Lines Indicate Resistance Levels – Red Lines Indicate Support Levels
Light Blue is a Pivot Point – Black represents the price when the report was produced