Market Wrap: Stocks, Bonds, Commodities
U.S. stock futures were trading lower during Monday’s evening deals, with major benchmark averages remaining closed during the regular session for a public holiday.
The Dow Jones Industrial Average rose 129.84 points to 33,826.69, the S&P 500 lose 0.28% to 4,079.09 and the Nasdaq Composite subtract 68.56 points to 11,787.27
MSCI’s index of Asia-Pacific stocks outside Japan is decline 0.91% to 645.78 levels. The Australian index was lower by 0.21% to 7,336.30. Japanese Nikkei Index fell 0.21% today.
European stocks were negative on Tuesday, with the Stoxx Europe 50 Index lose 0.27% to 4,259.55, Germany’s DAX fell 0.19% to 15,448.05, and France’s CAC decline 0.09% to 7,329.36, and U.K.’s FTSE 100 subtract 0.23% to 7,995.90.
Benchmark 10-year U.S. Treasury fell as demand for safe assets ascend again, today 10-year bond yields are positive 0.66% to 3.8530.
Oil prices rose over 1 percent on Monday, buoyed by optimism over Chinese demand, continued production curbs by major producers and Russia’s plans to rein in supply.
Spot Brent crude oil fell 0.64% to $83.53 per barrel. US West Texas Intermediate crude is up 0.44% to $76.89 a barrel.
The yellow metal gold is decline 0.41% to 1,842.65 dollars per ounce.
Market Wrap: Forex
Most Asian currencies fell on Tuesday, while the dollar advanced against a basket of currencies as markets awaited more cues on U.S. monetary policy from the minutes of the Federal Reserve’s February meeting and more inflation data.
Today, the U.S. dollar index measures the Greenback against a trade-weighted basket of six major currencies, which surge 0.22% to 104.007.
The Euro US Dollar (EUR/USD) is a widely traded pair that is down 0.11% today. This left the pair trading around $1.06700.
The Japanese yen was positive against the U.S. dollar on Tuesday. Today USD/JPY is advance 0.36% to the 134.710 level.
Another commodity-related currency negative against the U.S dollar, AUD/USD lose 0.36% to 0.68800, and NZD/USD fell 0.47% to 0.62200 level.
EUR/USD Intraday: Trend on the downside
Our pivot point is at 1.06750
Preferable Price Action: Take short positions below pivot level with targets at 1.06580 & 1.06480 in extension.
Alternative Price Action: Above pivot looks for a further upside to 1.06930 & 1.07030.
Comment: RSI is below 50 levels and Pairs below its 20MA & 55MA.
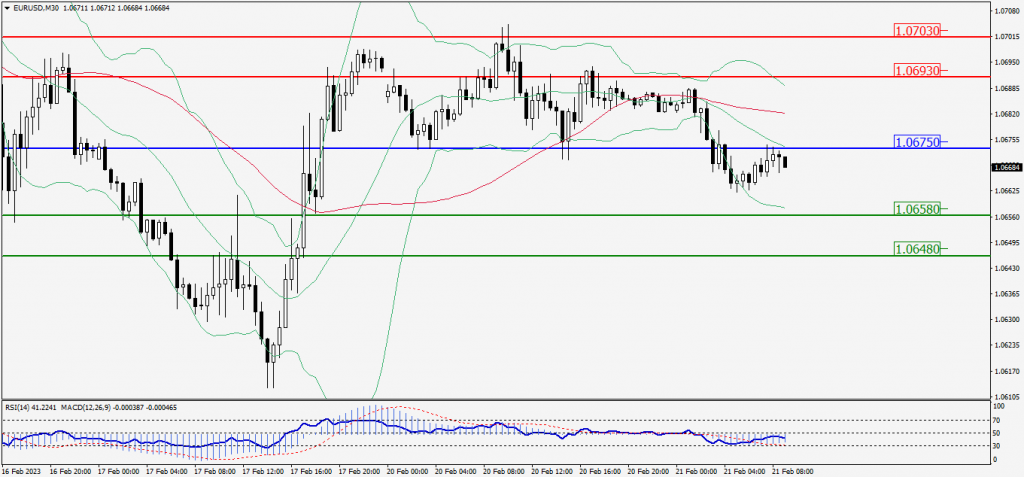
Green Lines Indicate Resistance Levels – Red Lines Indicate Support Levels
Light Blue is a Pivot Point – Black represents the price when the report was produced
GBP/USD Intraday: Major trend on the downside
Our pivot point is at 1.20070
Preferable Price Action: Sell positions below pivot with targets at 1.19780 & 1.19560 in extension.
Alternative Price Action: The price above pivot would call for further upside to 1.20390 & 1.20620.
Comment: RSI is below 50 levels and Pairs below its 20MA & 55MA.
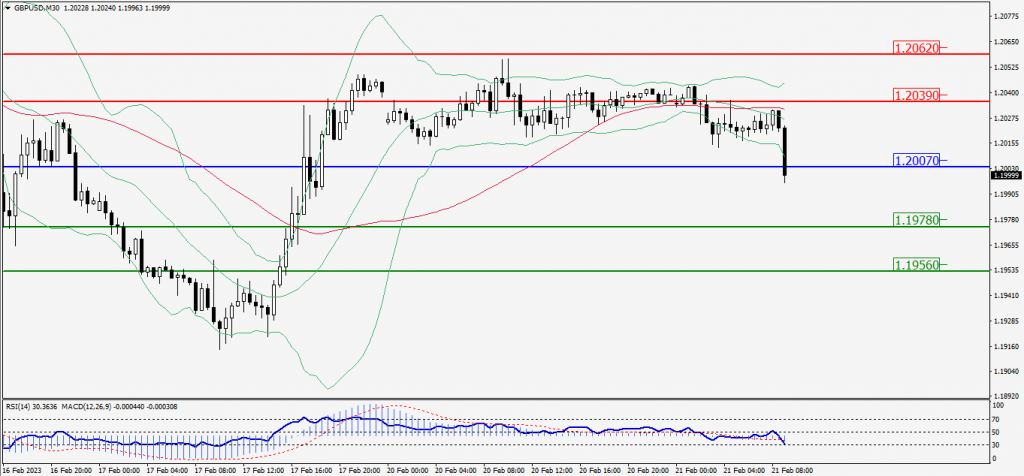
Green Lines Indicate Resistance Levels – Red Lines Indicate Support Levels
Light Blue is a Pivot Point – Black represents the price when the report was produced
USD/JPY Intraday: Major trend on the upside
Our pivot point is at 134.520
Preferable Price Action: Buy position above pivot with the target at 134.800 and 134.960 in extension.
Alternative Price Action: The downside breakout of the pivot would call for 134.240 and 134.070.
Comment: MACD is above 50 level and Pairs above its 20MA & 55MA.
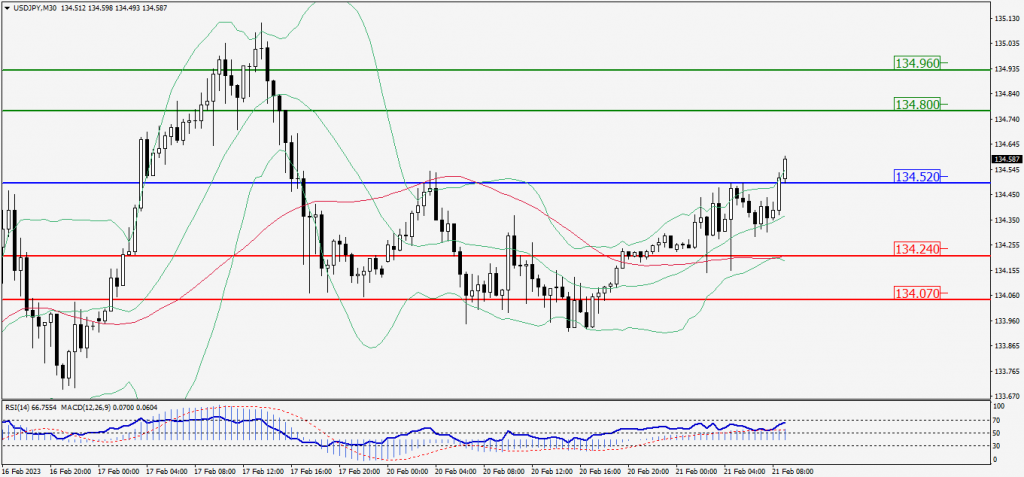
Green Lines Indicate Resistance Levels – Red Lines Indicate Support Levels
Light Blue is a Pivot Point – Black represents the price when the report was produced
AUD/USD Intraday: Trend on the downside
Our pivot point is at 0.68840
Preferable Price Action: Sell positions below pivot with targets at 0.68610 & 0.68420 in extension.
Alternative Price Action: Above pivot looks for a further upside with 0.69090 & 0.69270 as targets.
Comment: RSI is below 50 levels and pairs below its 20MA & 55MA.
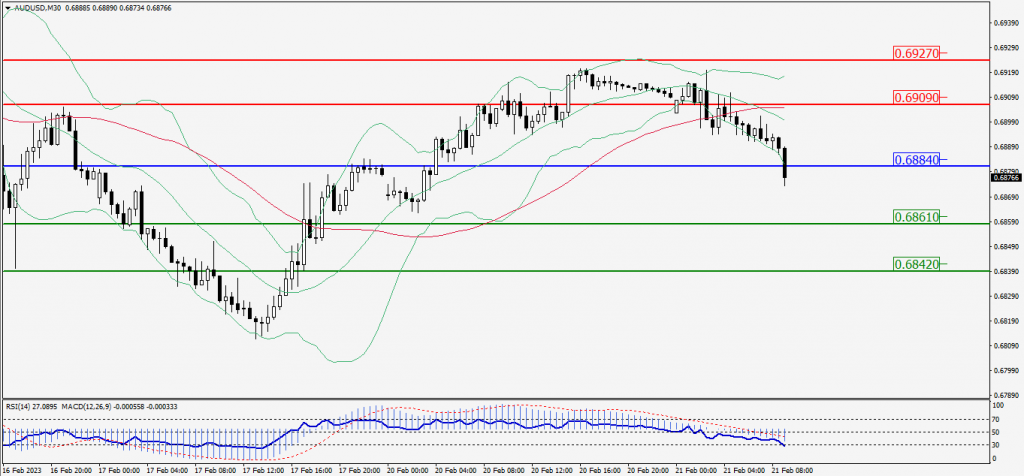
Green Lines Indicate Resistance Levels – Red Lines Indicate Support Levels
Light Blue is a Pivot Point – Black represents the price when the report was produced
CRUDEOIL Intraday: Resistance level at 76.97
Our pivot point is at 76.97
Preferable Price Action: Below pivot sell oil with 76.27 & 75.72 as targets.
Alternative Price Action: Buy crude above pivot with targets at 77.66 and 78.23 in extension.
Comment: MACD is negative territory and Pairs below its 20MA & 55MA.
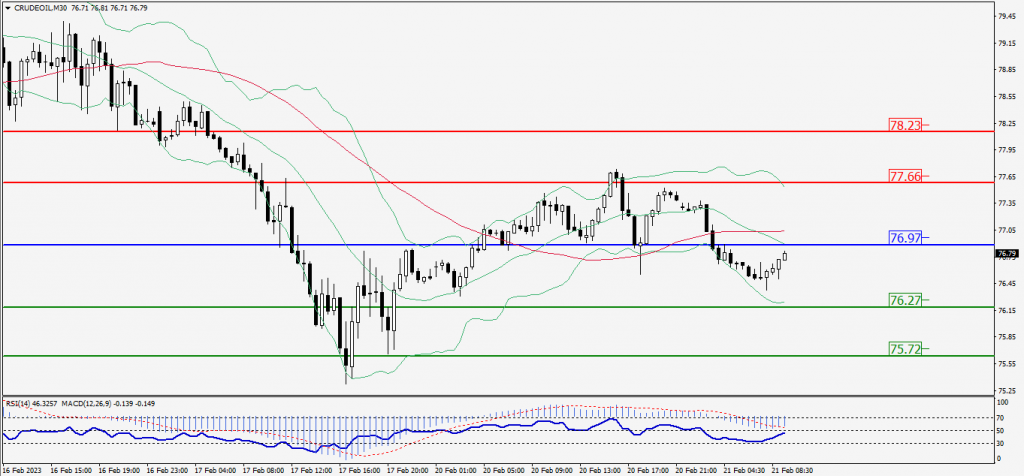
Green Lines Indicate Resistance Levels – Red Lines Indicate Support Levels
Light Blue is a Pivot Point – Black represents the price when the report was produced
XAU/USD Intraday: Trend on the downside
Our pivot point is 1837.60
Preferable Price Action: Further downside to 1830.20 and 1825.20
Alternative Price Action: If the price gives an upside breakout of a pivot, then the price extends to 1844.60 and 1849.60.
Comment: MACD is below 50 level and Pairs below its 20MA & 55MA..
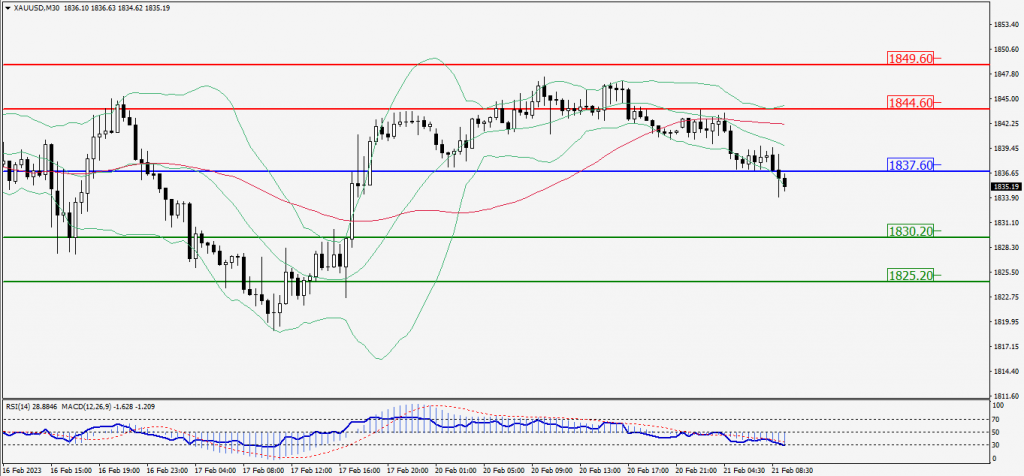
Green Lines Indicate Resistance Levels – Red Lines Indicate Support Levels
Light Blue is a Pivot Point – Black represents the price when the report was produced
Dow Jones Intraday: Trend on the downside
Our pivot point is 33,704.00
Preferable Price Action: Take sell positions below the pivot with targets at 33,581.00 & 33,490.00.
Alternative Price Action: Above 33,704.00 looks for further upside to 33,833.00 & 33,922.00.
Comment: RSI is below 50 levels and Pairs below its 20MA & 55MA.
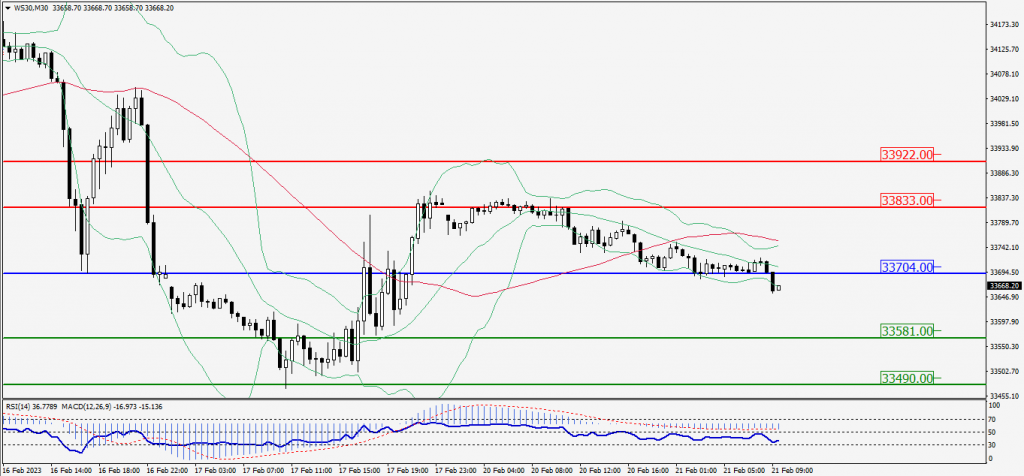
Green Lines Indicate Resistance Levels – Red Lines Indicate Support Levels
Light Blue is a Pivot Point – Black represents the price when the report was produced