Market Wrap: Stocks, Bonds, Commodities
The S&P 500 ended lower on Friday, weighed down by Microsoft and Nvidia as investors worried that inflation and a strong US economy could put the Federal Reserve on pace for more interest rate hikes.
The Dow Jones Industrial Average rose 129.84 points to 33,826.69, the S&P 500 lose 0.28% to 4,079.09 and the Nasdaq Composite subtract 68.56 points to 11,787.27
MSCI’s index of Asia-Pacific stocks outside Japan is advance 0.71% to 652.01 levels. The Australian index was higher by 0.06% to 7,351.50. Japanese Nikkei Index rose 0.07% today.
European stocks were negative on Monday, with the Stoxx Europe 50 Index lose 0.52% to 4,274.92, Germany’s DAX fell 0.33% to 15,482.00, and France’s CAC decline 0.25% to 7,347.72, and U.K.’s FTSE 100 subtract 0.10% to 8,004.36.
Benchmark 10-year U.S. Treasury fell as demand for safe assets ascend again, today 10-year bond yields are negative 0.30% to 3.8170.
Oil settled down $2 a barrel on Friday and ended the week markedly lower, as traders worried that future US interest rate hikes could weigh on demand and got nervous about mounting signs of ample crude and fuel supply.
Spot Brent crude oil rose 0.87% to $83.72 per barrel. US West Texas Intermediate crude is up 0.81% to $77.17 a barrel.
The yellow metal gold is advance 0.21% to 1,854.05 dollars per ounce.
Market Wrap: Forex
Most Asian currencies moved little on Monday, while the dollar steadied as markets awaited more signals on monetary policy from several Federal Reserve speakers and data sets due later in the week.
Today, the U.S. dollar index measures the Greenback against a trade-weighted basket of six major currencies, which slipped 0.06% to 103.718.
The Euro US Dollar (EUR/USD) is a widely traded pair that is up 0.07% today. This left the pair trading around $1.07010.
The Japanese yen was negative against the U.S. dollar on Monday. Today USD/JPY is decline 0.09% to the 134.020 level.
Another commodity-related currency positive against the U.S dollar, AUD/USD gain 0.42 to 0.69080, and NZD/USD rose 0.02% to 0.62450 level.
EUR/USD Intraday: Support level at 1.06880
Our pivot point is at 1.06880
Preferable Price Action: Take long positions above pivot level with targets at 1.07130 & 1.07310 in extension.
Alternative Price Action: Below pivot looks for a further downside to 1.06630 & 1.06450.
Comment: RSI is above 50 levels and Pairs above its 20MA & 55MA.
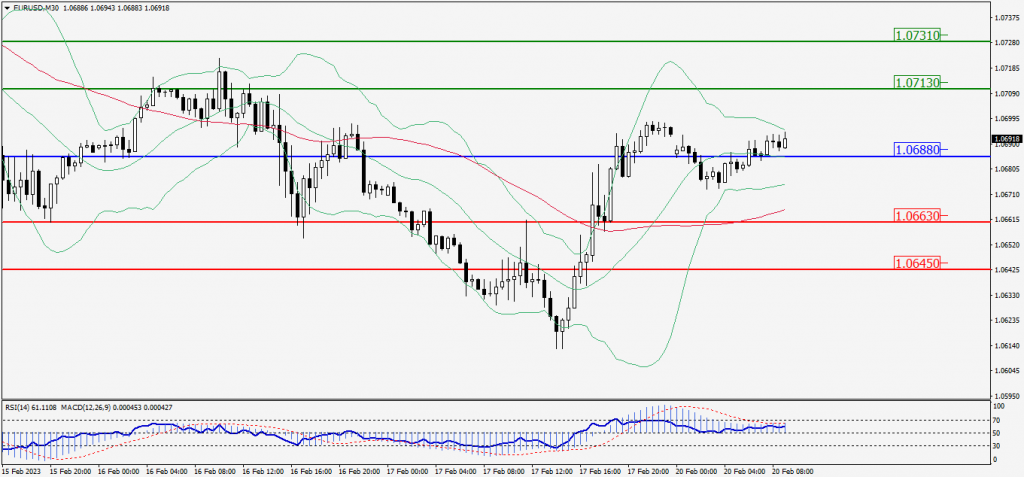
Green Lines Indicate Resistance Levels – Red Lines Indicate Support Levels
Light Blue is a Pivot Point – Black represents the price when the report was produced
GBP/USD Intraday: Support level at 1.20230
Our pivot point is at 1.20230
Preferable Price Action: Buy positions above pivot with targets at 1.21190 & 1.21820 in extension.
Alternative Price Action: The price below pivot would call for further downside to 1.19220 & 1.18620.
Comment: RSI is above 50 levels and Pairs above 55MA.
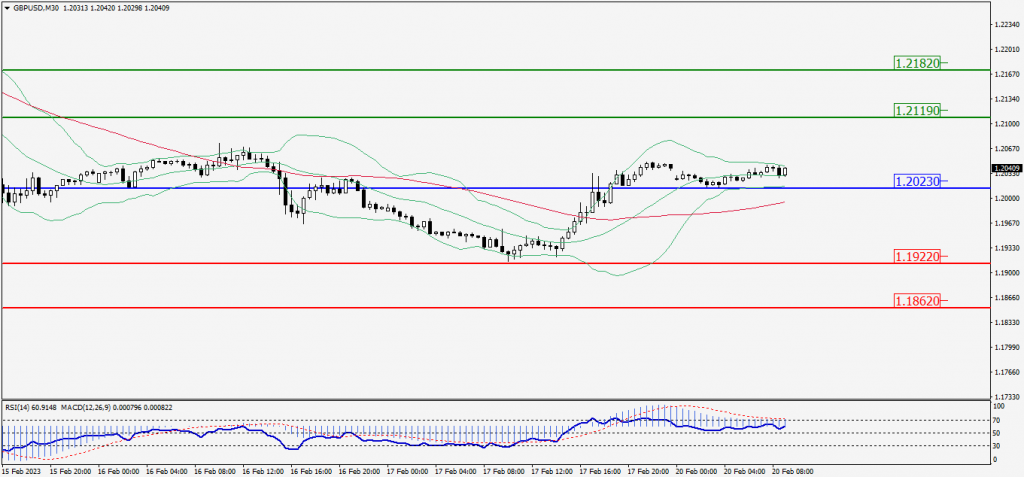
Green Lines Indicate Resistance Levels – Red Lines Indicate Support Levels
Light Blue is a Pivot Point – Black represents the price when the report was produced
USD/JPY Intraday: Resistance level at 134.330
Our pivot point is at 134.330
Preferable Price Action: Sell position below pivot with the target at 133.600 and 133.160 in extension.
Alternative Price Action: The upside breakout of the pivot would call for 135.100 and 135.530.
Comment: MACD is below 50 level and Pairs below its 20MA & 55MA.
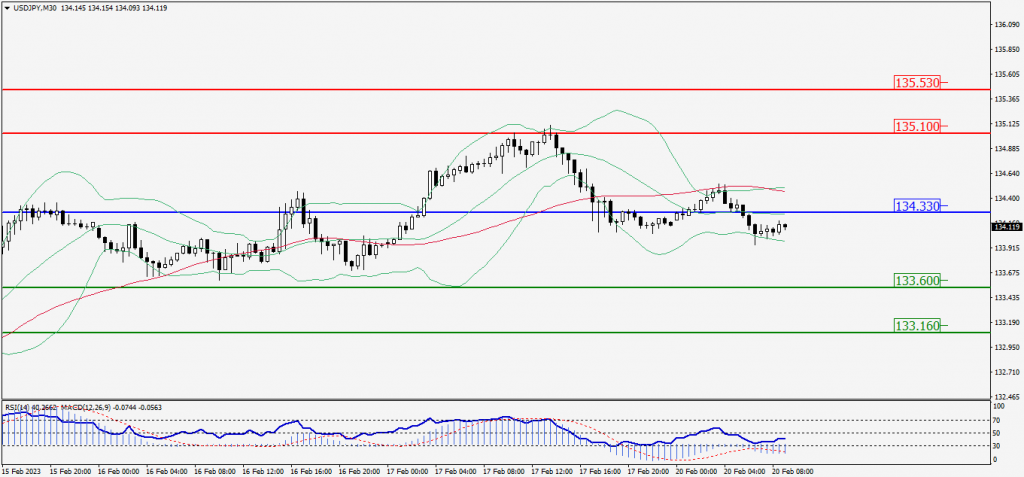
Green Lines Indicate Resistance Levels – Red Lines Indicate Support Levels
Light Blue is a Pivot Point – Black represents the price when the report was produced
AUD/USD Intraday: Trend on the upside
Our pivot point is at 0.69000
Preferable Price Action: Buy positions above pivot with targets at 0.69250 & 0.69410 in extension.
Alternative Price Action: Below pivot looks for a further downside with 0.68730 & 0.68570 as targets.
Comment: RSI is above 50 levels and pairs above its 20MA & 55MA.
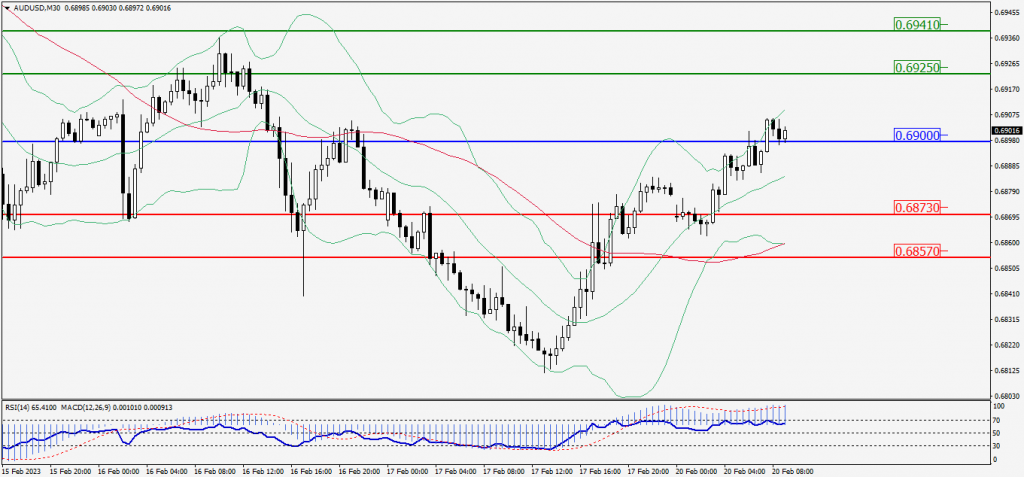
Green Lines Indicate Resistance Levels – Red Lines Indicate Support Levels
Light Blue is a Pivot Point – Black represents the price when the report was produced
CRUDEOIL Intraday: Trend on the upside
Our pivot point is at 76.97
Preferable Price Action: Above pivot buy oil with 77.90 & 78.43 as targets.
Alternative Price Action: Sell crude below pivot with targets at 76.07 and 75.57 in extension.
Comment: MACD is positive territory and Pairs above its 20MA & 55MA.
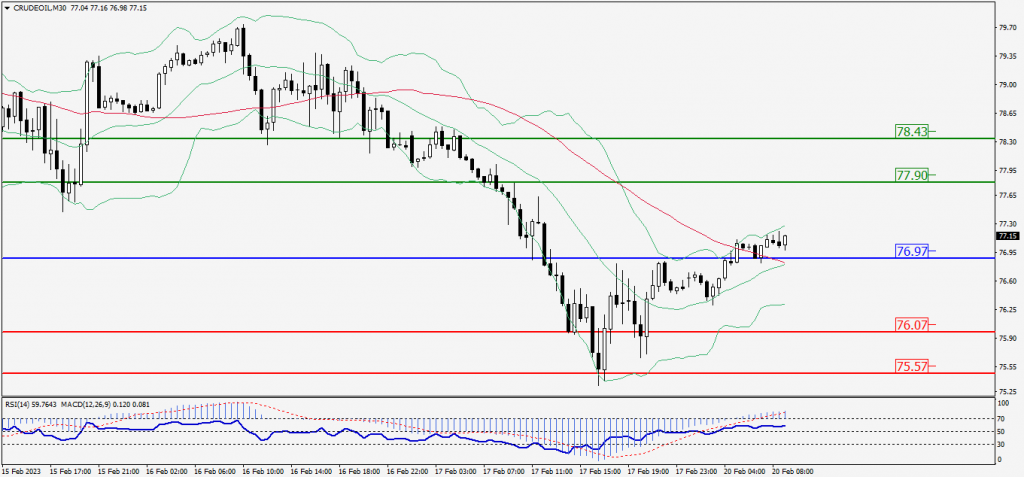
Green Lines Indicate Resistance Levels – Red Lines Indicate Support Levels
Light Blue is a Pivot Point – Black represents the price when the report was produced
XAU/USD Intraday: Trend on the upside
Our pivot point is 1843.40
Preferable Price Action: Further upside to 1853.10 and 1859.70
Alternative Price Action: If the price gives a downside breakout of a pivot, then the price extends to 1833.90 and 1827.80.
Comment: MACD is above 50 level and Pairs above its 20MA & 55MA..
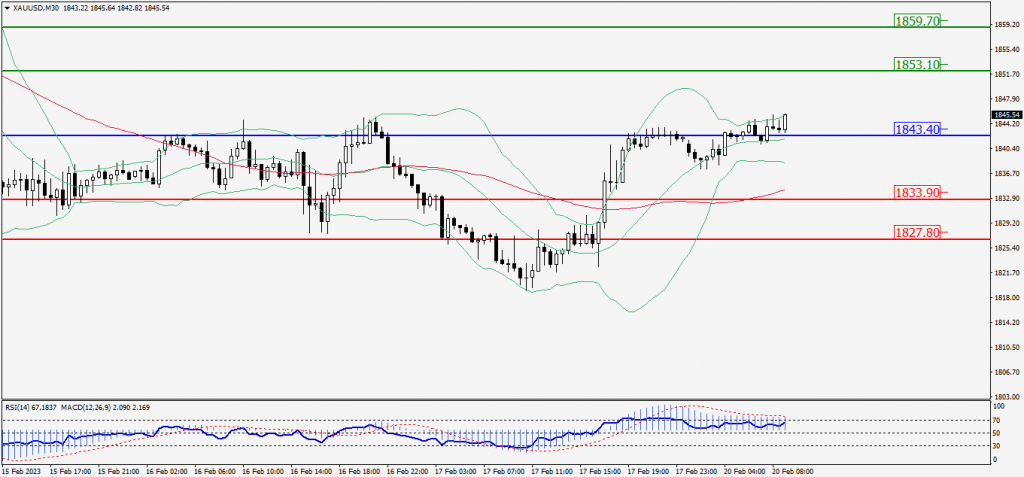
Green Lines Indicate Resistance Levels – Red Lines Indicate Support Levels
Light Blue is a Pivot Point – Black represents the price when the report was produced
Dow Jones Intraday: Major trend on the upside
Our pivot point is 33,830.00
Preferable Price Action: Take buy positions above the pivot with targets at 33,847.00 & 33,859.00.
Alternative Price Action: Below 33,830.00 looks for further downside to 33,814.00 & 33,802.00.
Comment: RSI is above 50 levels and Pairs above its 20MA & 55MA.
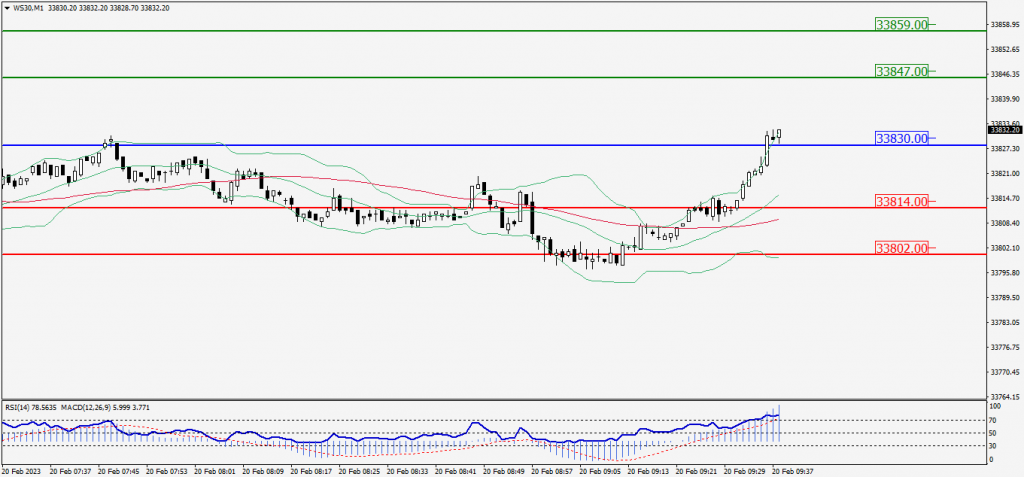
Green Lines Indicate Resistance Levels – Red Lines Indicate Support Levels
Light Blue is a Pivot Point – Black represents the price when the report was produced