Market Wrap: Stocks, Bonds, Commodities
The S&P 500 ended nominally lower on Wednesday as a string of corporate earnings ran the gamut from downbeat to dismal, reviving worries over the economic impact of the U.S. Federal Reserve’s restrictive policy.
The Dow Jones Industrial Average rose 9.88 points to 33,743.84, the S&P 500 lose 0.02% to 4,016.22 and the Nasdaq Composite subtract 20.92 points to 11,313.36.
MSCI’s index of Asia-Pacific stocks outside Japan is ascend 1.17% to 682.88 levels. The Australian index was lower by 0.30% to 7,468.30. Japanese Nikkei Index lose 0.12% today.
European stocks were negative on Thursday, with the Stoxx Europe 50 Index fell 0.12% to 4,148.11, Germany’s DAX lose 0.08% to 15,081.64, and France’s CAC decline 0.09% to 7,043.88, and U.K.’s FTSE 100 subtract 0.16% to 7,744.87.
Benchmark 10-year U.S. Treasury fell as demand for safe assets ascend again, today 10-year bond yields are negative 0.33% to 3.451.
Oil prices were steady on Thursday after U.S. crude stocks climbed less than expected, while investors awaited further clarity on supply drivers, including an OPEC+ meeting and the looming EU ban on Russian refined products.
Spot Brent crude oil rose 0.21% to $86.30 per barrel. US West Texas Intermediate crude is up 0.42% to $80.49 a barrel.
The yellow metal gold is decline 0.05% to 1,941.65 dollars per ounce.
Market Wrap: Forex
Bullish bets on the Singapore dollar and the Malaysian ringgit further consolidated to scale five-year highs as a fizzling U.S. dollar rally and China’s pivot from its strict COVID-19 curbs boosted investor appetite for Asian emerging currencies, a Reuters poll showed on Thursday.
Today, the U.S. dollar index measures the Greenback against a trade-weighted basket of six major currencies, which surge 0.02% to 101.438.
The Euro US Dollar (EUR/USD) is a widely traded pair that is up 0.02% today. This left the pair trading around $1.0917.
The Japanese yen was negative against the U.S. dollar on Thursday. Today USD/JPY is drop 0.02% to the 129.56 level.
Another commodity-related currency positive against the U.S dollar, AUD/USD rose 0.17% to 0.7114, and NZD/USD gain 0.15% to 0.6486 level.
EUR/USD Intraday: In a consolidation zone
Our pivot point is at 1.09100
Preferable Price Action: Take long positions above pivot level with targets at 1.09280 & 1.09400 in extension.
Alternative Price Action: Below pivot looks for a further downside to 1.08930 & 1.08810.
Comment: RSI is at 50 levels and Pairs above 55MA.
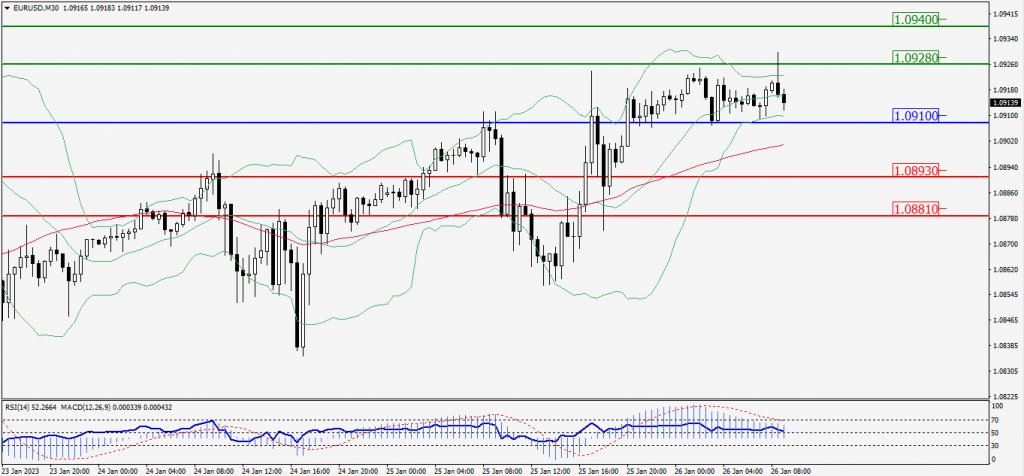
Green Lines Indicate Resistance Levels – Red Lines Indicate Support Levels
Light Blue is a Pivot Point – Black represents the price when the report was produced
GBP/USD Intraday: In a consolidation zone
Our pivot point is at 1.24030
Preferable Price Action: Sell positions below pivot with targets at 1.23600 & 1.23310 in extension.
Alternative Price Action: The price above pivot would call for further upside to 1.24450 & 1.24740.
Comment: RSI is at 50 levels and Pairs below 20MA.
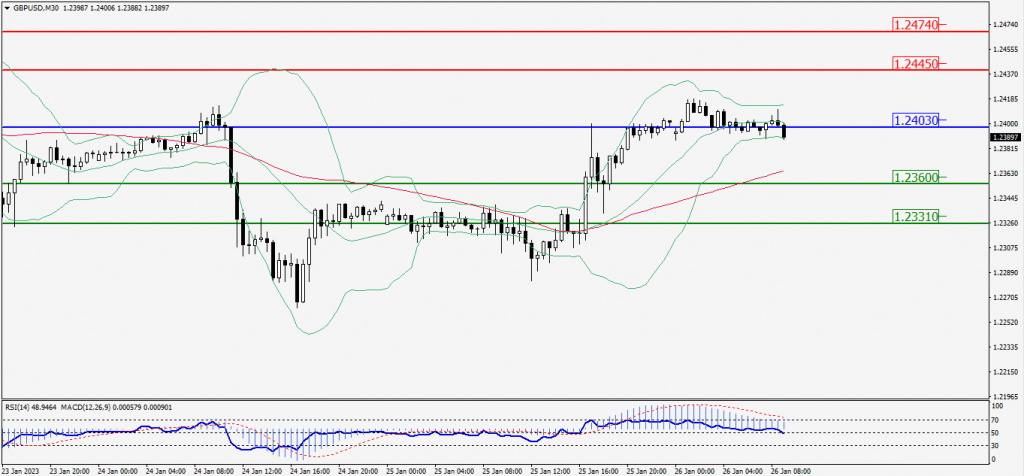
Green Lines Indicate Resistance Levels – Red Lines Indicate Support Levels
Light Blue is a Pivot Point – Black represents the price when the report was produced
USD/JPY Intraday: Trend on the upside
Our pivot point is at 129.550
Preferable Price Action: Buy position above pivot with the target at 129.970 and 130.230 in extension.
Alternative Price Action: The downside breakout of the pivot would call for 129.160 and 128.910.
Comment: MACD is above 50 level and Pairs above 20MA.
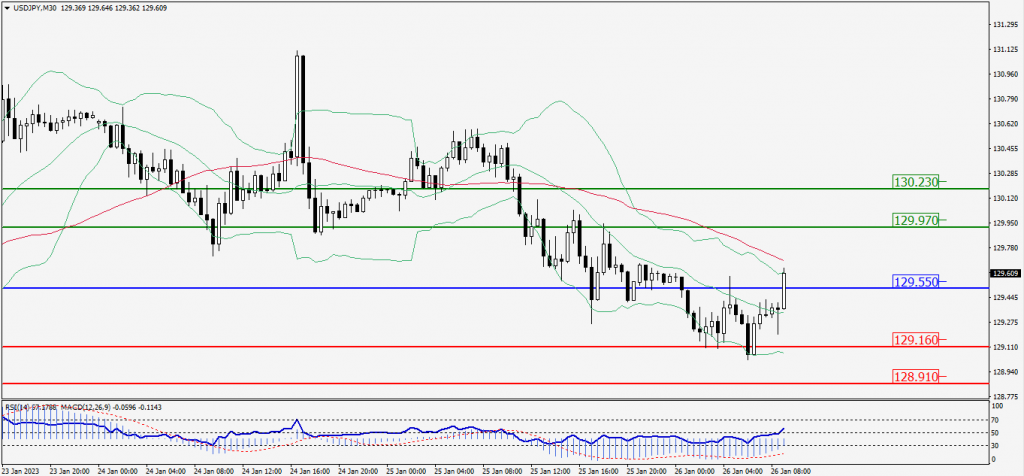
Green Lines Indicate Resistance Levels – Red Lines Indicate Support Levels
Light Blue is a Pivot Point – Black represents the price when the report was produced
AUD/USD Intraday: In a consolidation zone
Our pivot point is at 0.71220
Preferable Price Action: Sell positions below pivot with targets at 0.70770 & 0.70440 in extension.
Alternative Price Action: Above pivot looks for a further upside with 0.71690 & 0.72020 as targets.
Comment: RSI is at 50 levels and pairs below 20MA.
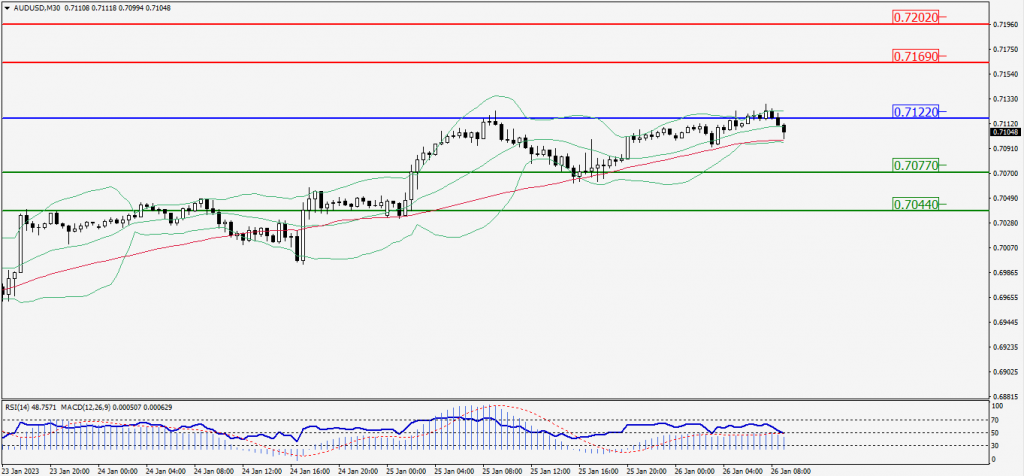
Green Lines Indicate Resistance Levels – Red Lines Indicate Support Levels
Light Blue is a Pivot Point – Black represents the price when the report was produced
CRUDEOIL Intraday: In a consolidation zone
Our pivot point is at 80.60
Preferable Price Action: Below pivot sell oil with 80.02 & 79.59 as targets.
Alternative Price Action: Buy crude above pivot with targets at 81.16 and 81.58 in extension.
Comment: MACD is flat territory and Pairs below 20MA.
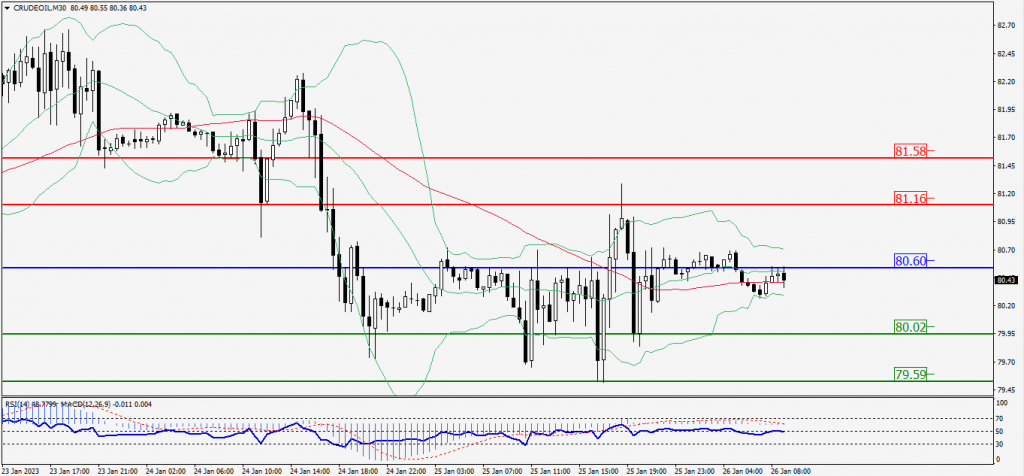
Green Lines Indicate Resistance Levels – Red Lines Indicate Support Levels
Light Blue is a Pivot Point – Black represents the price when the report was produced
XAU/USD Intraday: Trend on the downside
Our pivot point is 1944.40
Preferable Price Action: Further downside to 1935.20 and 1929.40
Alternative Price Action: If the price gives a upside breakout of a pivot, then the price extends to 1954.40 and 1960.10.
Comment: MACD is below 50 level and Pairs below 20MA.
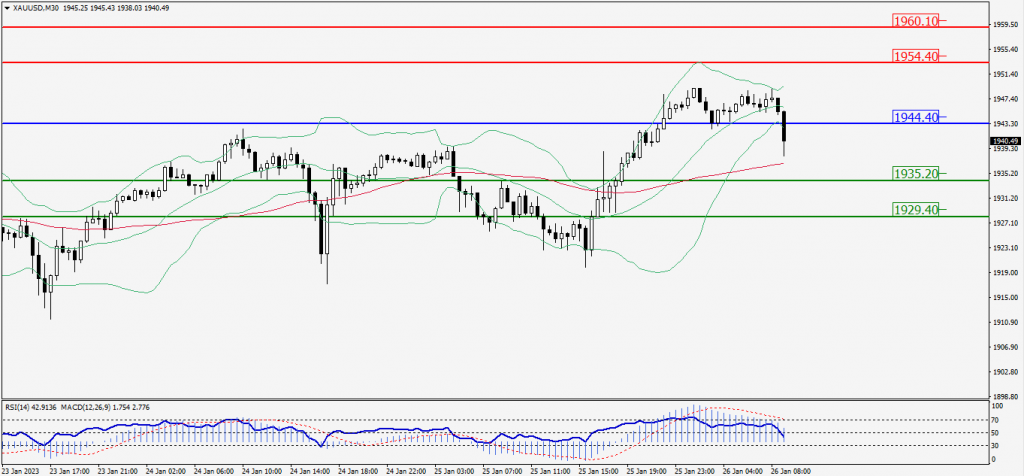
Green Lines Indicate Resistance Levels – Red Lines Indicate Support Levels
Light Blue is a Pivot Point – Black represents the price when the report was produced
Dow Jones Intraday: Support level at 33,752.00
Our pivot point is 33,752.00
Preferable Price Action: Take buy positions up the pivot with targets at 33,901.00 & 33,996.00.
Alternative Price Action: Below 33,752.00 looks for further downside to 33,609.00 & 33,518.00.
Comment: RSI is above 50 levels and Pairs above its 20MA & 55MA.
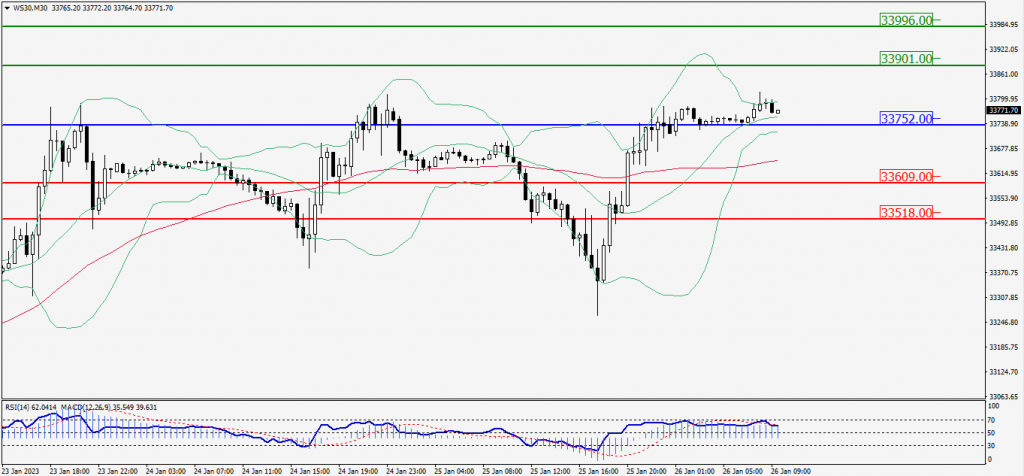
Green Lines Indicate Resistance Levels – Red Lines Indicate Support Levels
Light Blue is a Pivot Point – Black represents the price when the report was produced