Market Wrap: Stocks, Bonds, Commodities
The S&P 500 ended nominally lower on Tuesday at the close of a rocky session marked by a raft of mixed earnings and a technical malfunction at the opening bell.
The Dow Jones Industrial Average rose 104.40 points to 33,733.96, the S&P 500 lose 0.07% to 4,016.95 and the Nasdaq Composite subtract 30.14 points to 11,334.27.
MSCI’s index of Asia-Pacific stocks outside Japan is ascend 0.19% to 675.03 levels. The Australian index was lower by 0.30% to 7,468.30. Japanese Nikkei Index gain 0.35% today.
European stocks were mix on Wednesday, with the Stoxx Europe 50 Index rose 0.05% to 4,153.02, Germany’s DAX lose 0.07% to 15,093.11, and France’s CAC advance 0.26% to 7,050.48, and U.K.’s FTSE 100 subtract 0.35% to 7,757.36.
Benchmark 10-year U.S. Treasury fell as demand for safe assets ascend again, today 10-year bond yields are positive 0.06% to 3.469.
Crude oil prices slipped on Tuesday on concerns about a global economic slowdown and as preliminary data indicated a bigger-than-expected build in US oil inventories.
Spot Brent crude oil rose 0.19% to $86.29 per barrel. US West Texas Intermediate crude is up 0.06% to $80.18 a barrel.
The yellow metal gold is advance 0.36% to 1,928.35 dollars per ounce.
Market Wrap: Forex
The Australian dollar rallied to a five-month high on Wednesday after fourth-quarter consumer inflation read higher than expected, while most Asian currencies moved little as fears of a global recession offset optimism over a potential economic recovery in China.
Today, the U.S. dollar index measures the Greenback against a trade-weighted basket of six major currencies, which surge 0.08% to 101.757.
The Euro US Dollar (EUR/USD) is a widely traded pair that is down 0.02% today. This left the pair trading around $1.0885.
The Japanese yen was positive against the U.S. dollar on Wednesday. Today USD/JPY is ascend 0.23% to the 130.44 level.
Another commodity-related currency mixed against the U.S dollar, AUD/USD rose 0.78% to 0.7102, and NZD/USD lose 0.29% to 0.6483 level.
EUR/USD Intraday: Trend on the upside
Our pivot point is at 1.09010
Preferable Price Action: Take long positions above pivot level with targets at 1.09290 & 1.09460 in extension.
Alternative Price Action: Below pivot looks for a further downside to 1.08750 & 1.08580.
Comment: RSI is above 50 levels and Pairs above its 20MA & 55MA.
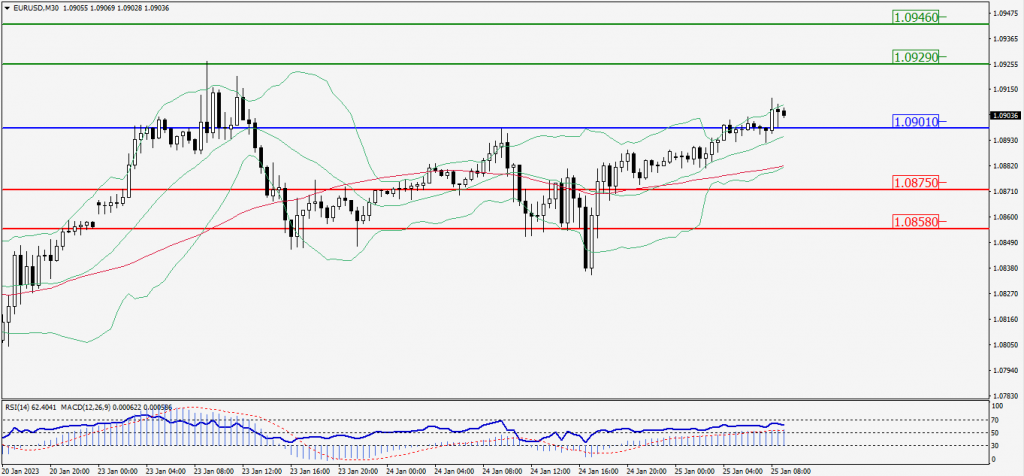
Green Lines Indicate Resistance Levels – Red Lines Indicate Support Levels
Light Blue is a Pivot Point – Black represents the price when the report was produced
GBP/USD Intraday: In a consolidation zone
Our pivot point is at 1.23370
Preferable Price Action: Sell positions below pivot with targets at 1.23080 & 1.22880 in extension.
Alternative Price Action: The price above pivot would call for further upside to 1.23680 & 1.23880.
Comment: RSI is below 50 levels and Pairs below its 55MA.
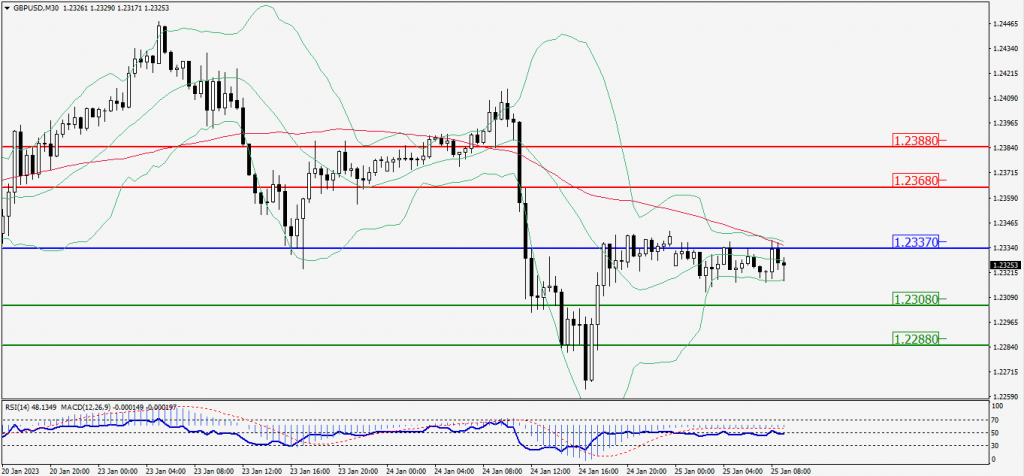
Green Lines Indicate Resistance Levels – Red Lines Indicate Support Levels
Light Blue is a Pivot Point – Black represents the price when the report was produced
USD/JPY Intraday: Trend on the upside
Our pivot point is at 130.370
Preferable Price Action: Buy position above pivot with the target at 130.770 and 130.990 in extension.
Alternative Price Action: The downside breakout of the pivot would call for 130.000 and 129.790.
Comment: MACD is above 50 level and Pairs above its 20MA & 55MA.
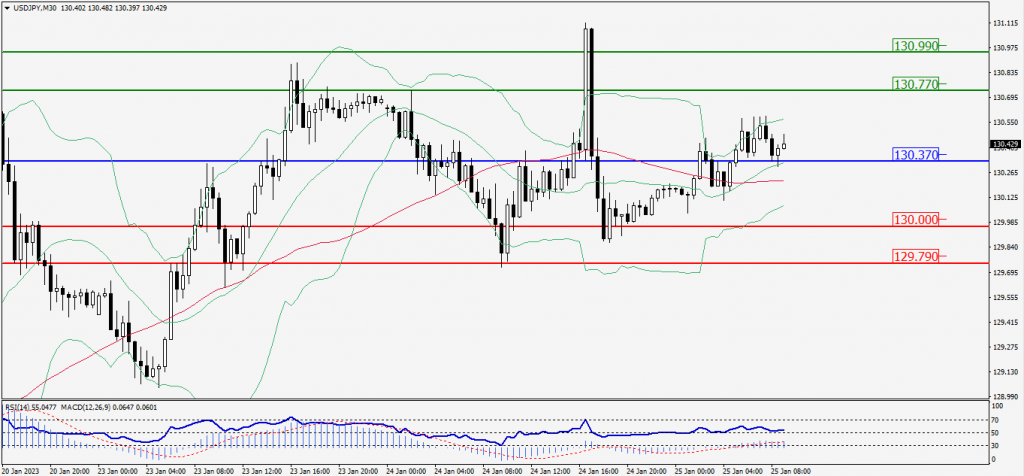
Green Lines Indicate Resistance Levels – Red Lines Indicate Support Levels
Light Blue is a Pivot Point – Black represents the price when the report was produced
AUD/USD Intraday: Major trend on the upside
Our pivot point is at 0.71100
Preferable Price Action: Buy positions above pivot with targets at 0.71680 & 0.72050 in extension.
Alternative Price Action: Below pivot looks for a further downside with 0.70560 & 0.70190 as targets.
Comment: RSI is above 50 levels and pairs above its 20MA & 55MA.
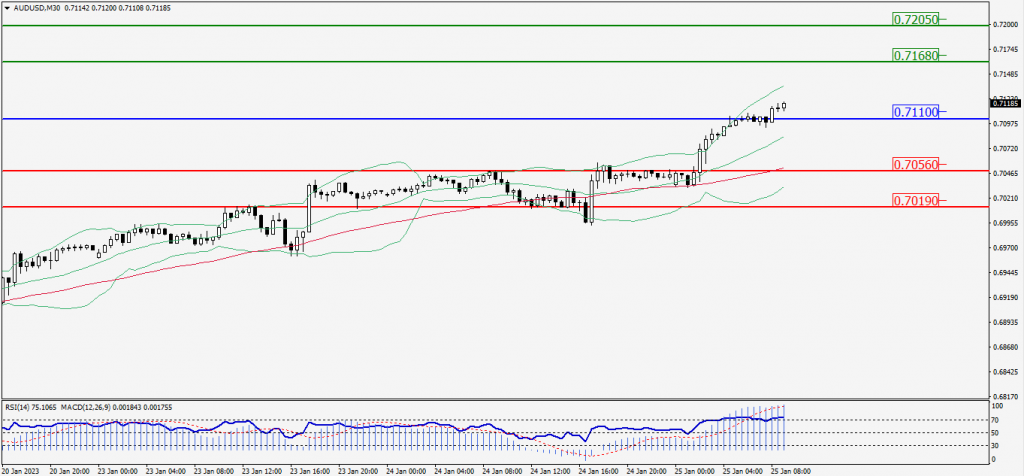
Green Lines Indicate Resistance Levels – Red Lines Indicate Support Levels
Light Blue is a Pivot Point – Black represents the price when the report was produced
CRUDEOIL Intraday: Resistance level at 80.56
Our pivot point is at 80.56
Preferable Price Action: Below pivot sell oil with 79.93 & 79.51 as targets.
Alternative Price Action: Buy crude above pivot with targets at 81.18 and 81.61 in extension.
Comment: MACD is negative territory and Pairs below 55MA.
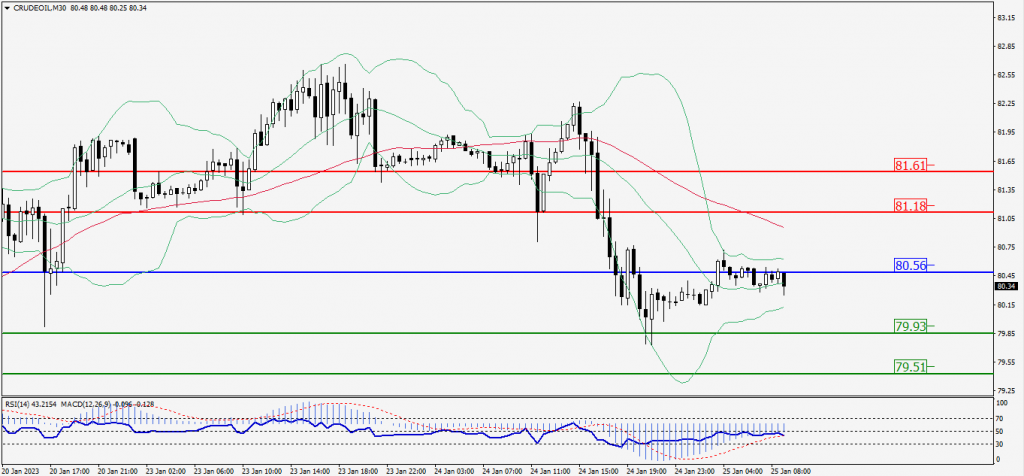
Green Lines Indicate Resistance Levels – Red Lines Indicate Support Levels
Light Blue is a Pivot Point – Black represents the price when the report was produced
XAU/USD Intraday: Trend on the downside
Our pivot point is 1932.20
Preferable Price Action: Further downside to 1926.80 and 1923.50
Alternative Price Action: If the price gives a upside breakout of a pivot, then the price extends to 1937.70 and 1941.30.
Comment: MACD is below 50 level and Pairs below its 20MA & 55MA.
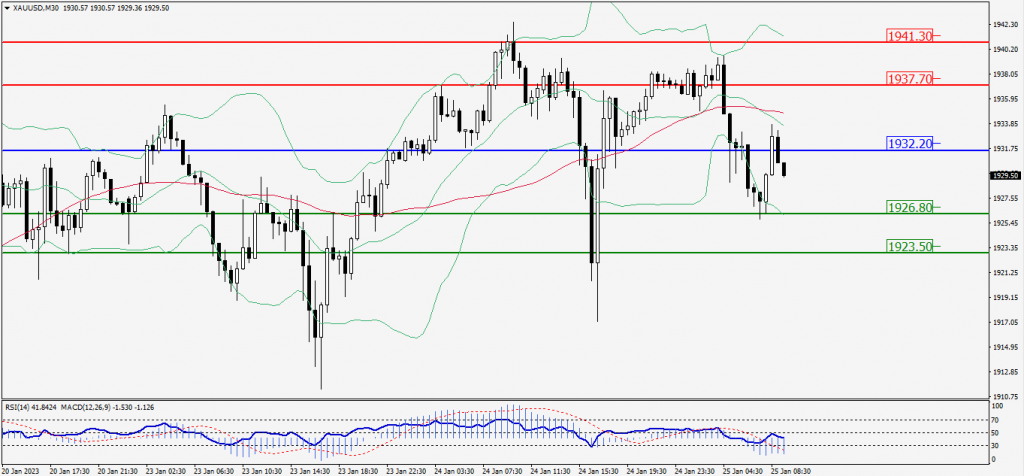
Green Lines Indicate Resistance Levels – Red Lines Indicate Support Levels
Light Blue is a Pivot Point – Black represents the price when the report was produced
Dow Jones Intraday: Support level at 33,667.00
Our pivot point is 33,667.00
Preferable Price Action: Take buy positions up the pivot with targets at 33,860.00 & 33,985.00.
Alternative Price Action: Below 33,667.00 looks for further downside to 33,481.00 & 33,361.00.
Comment: RSI is above 50 levels and Pairs above 55MA.
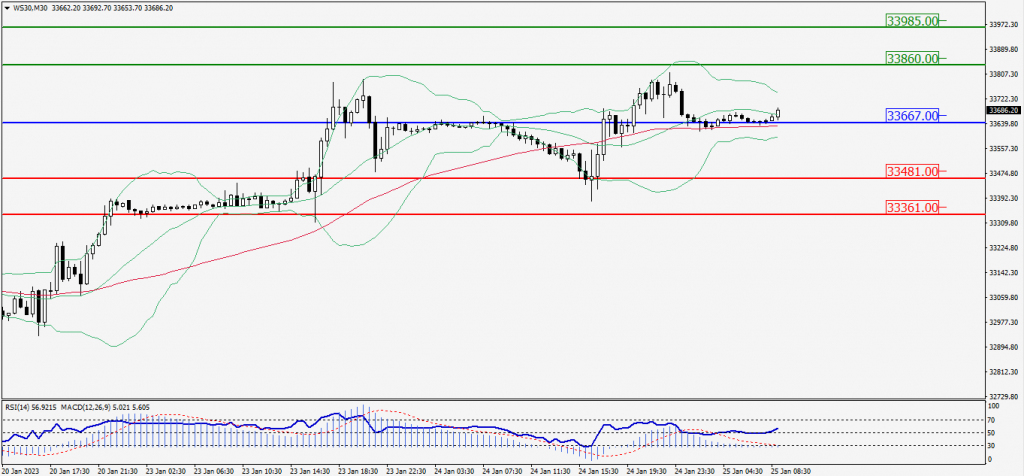
Green Lines Indicate Resistance Levels – Red Lines Indicate Support Levels
Light Blue is a Pivot Point – Black represents the price when the report was produced