Market Wrap: Stocks, Bonds, Commodities
Australian shares inched higher on Monday to their highest in nearly nine months, as technology stocks tracked Wall Street’s strong finish last week and firm crude oil prices lifted energy stocks.
The Dow Jones Industrial Average rose 330.93 points to 33,375.49, the S&P 500 gain 1.89% to 3,972.61 and the Nasdaq Composite add 288.17 points to 11,140.43.
MSCI’s index of Asia-Pacific stocks outside Japan is ascend 0.11% to 674.63 levels. The Australian index was higher by 0.07% to 7,457.30. Japanese Nikkei Index gain 1.33% today.
European stocks were positive on Monday, with the Stoxx Europe 50 Index rose 0.63% to 4,119.90, Germany’s DAX gain 0.76% to 15,033.56, and France’s CAC advance 0.63% to 6,995.99, and U.K.’s FTSE 100 add 0.30% to 7,770.59.
Benchmark 10-year U.S. Treasury fell as demand for safe assets ascend again, today 10-year bond yields are positive 0.27% to 3.493.
Oil prices drifted lower in early trade on Monday, thinned by the Lunar New Year holiday in east Asia, but held on to most of last week’s gains on the prospect of an economic recovery in top oil importer China this year.
Spot Brent crude oil fell 0.29% to $87.38 per barrel. US West Texas Intermediate crude is down 0.24% to $81.44 a barrel.
The yellow metal gold is decline 0.32% to 1,922.05 dollars per ounce.
Market Wrap: Forex
The euro scaled a nine-month high on the dollar on Monday as more hawkish comments on European interest rates contrasted with market pricing for a less aggressive Federal Reserve.
Today, the U.S. dollar index measures the Greenback against a trade-weighted basket of six major currencies, which slipped 0.25% to 101.530.
The Euro US Dollar (EUR/USD) is a widely traded pair that is up 0.44% today. This left the pair trading around $1.0903.
The Japanese yen was positive against the U.S. dollar on Monday. Today USD/JPY is ascend 0.41% to the 130.09 level.
Another commodity-related currency mixed against the U.S dollar, AUD/USD rose 0.14% to 0.6976, and NZD/USD lose 0.08% to 0.6467 level.
EUR/USD Intraday: Major trend on the upside
Our pivot point is at 1.09030
Preferable Price Action: Take long positions above pivot level with targets at 1.09340 & 1.09560 in extension.
Alternative Price Action: Below pivot looks for a further downside to 1.08690 & 1.08490.
Comment: RSI is above 50 levels and Pairs above its 20MA & 55MA.
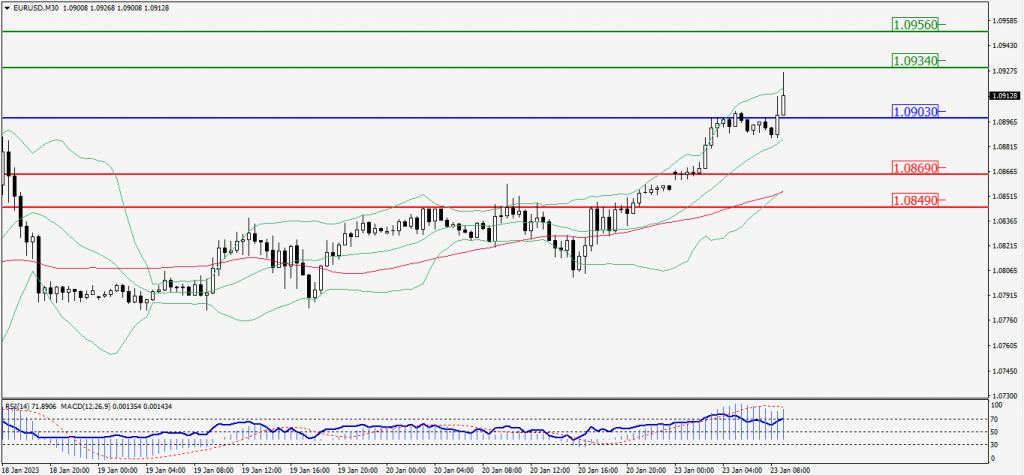
Green Lines Indicate Resistance Levels – Red Lines Indicate Support Levels
Light Blue is a Pivot Point – Black represents the price when the report was produced
GBP/USD Intraday: Trend on the upside
Our pivot point is at 1.24180
Preferable Price Action: Buy positions above pivot with targets at 1.24430 & 1.24570 in extension.
Alternative Price Action: The price below pivot would call for further downside to 1.23950 & 1.23780.
Comment: RSI is above 50 levels and Pairs above 55MA.
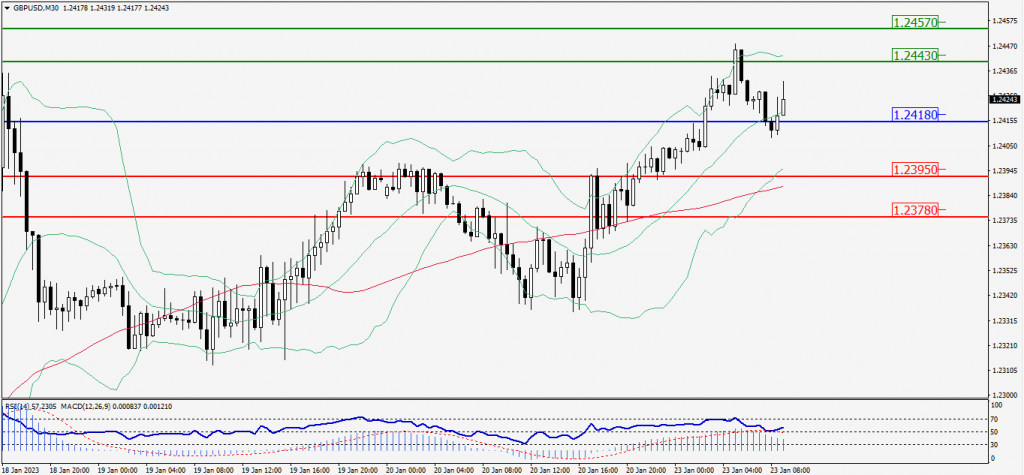
Green Lines Indicate Resistance Levels – Red Lines Indicate Support Levels
Light Blue is a Pivot Point – Black represents the price when the report was produced
USD/JPY Intraday: Trend on the upside
Our pivot point is at 129.870
Preferable Price Action: Buy position above pivot with the target at 130.420 and 130.740 in extension.
Alternative Price Action: The downside breakout of the pivot would call for 129.370 and 129.020.
Comment: MACD is above 50 level and Pairs above its 20MA & 55MA.
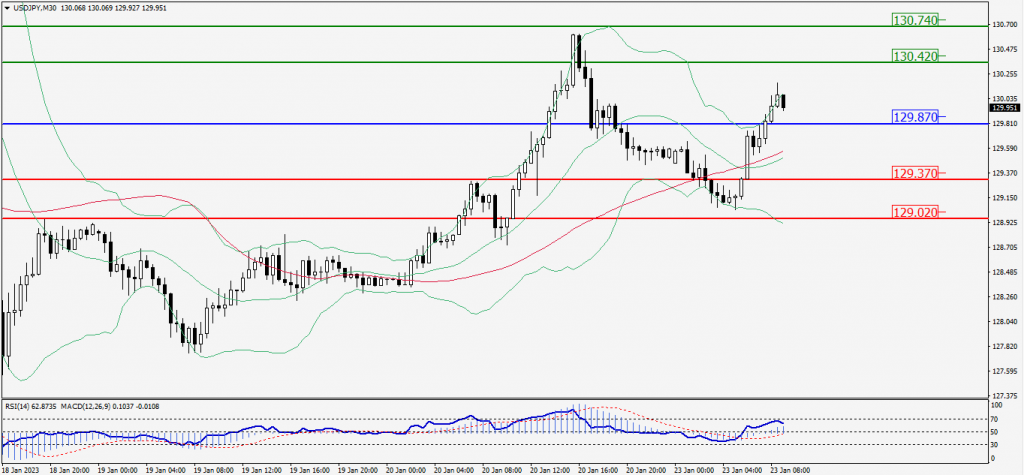
Green Lines Indicate Resistance Levels – Red Lines Indicate Support Levels
Light Blue is a Pivot Point – Black represents the price when the report was produced
AUD/USD Intraday: Support level at 0.69760
Our pivot point is at 0.69760
Preferable Price Action: Buy positions above pivot with targets at 0.70120 & 0.70310 in extension.
Alternative Price Action: Below pivot looks for a further downside with 0.69430 & 0.69250 as targets.
Comment: RSI is above 50 levels and pairs above 55MA.
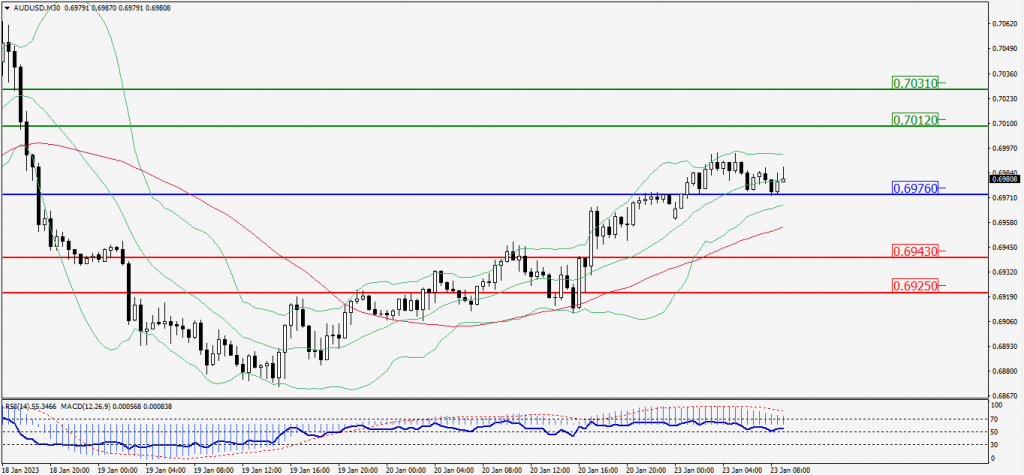
Green Lines Indicate Resistance Levels – Red Lines Indicate Support Levels
Light Blue is a Pivot Point – Black represents the price when the report was produced
CRUDEOIL Intraday: Trend on the upside
Our pivot point is at 81.53
Preferable Price Action: Above pivot buy oil with 82.26 & 82.67 as targets.
Alternative Price Action: Sell crude down pivot with targets at 80.87 and 80.45 in extension.
Comment: MACD is positive territory and Pairs above its 20MA & 55MA.
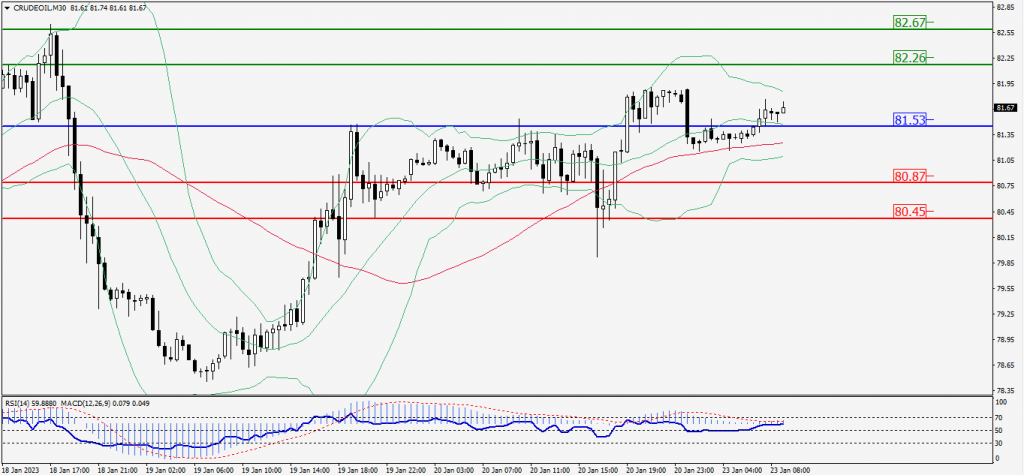
Green Lines Indicate Resistance Levels – Red Lines Indicate Support Levels
Light Blue is a Pivot Point – Black represents the price when the report was produced
XAU/USD Intraday: Major trend on the downside
Our pivot point is 1925.30
Preferable Price Action: Further downside to 1919.50 and 1915.60
Alternative Price Action: If the price gives an upside breakout of a pivot, then the price extends to 1931.20 and 1935.10.
Comment: MACD is below 50 level and Pairs below its 20MA & 55MA.
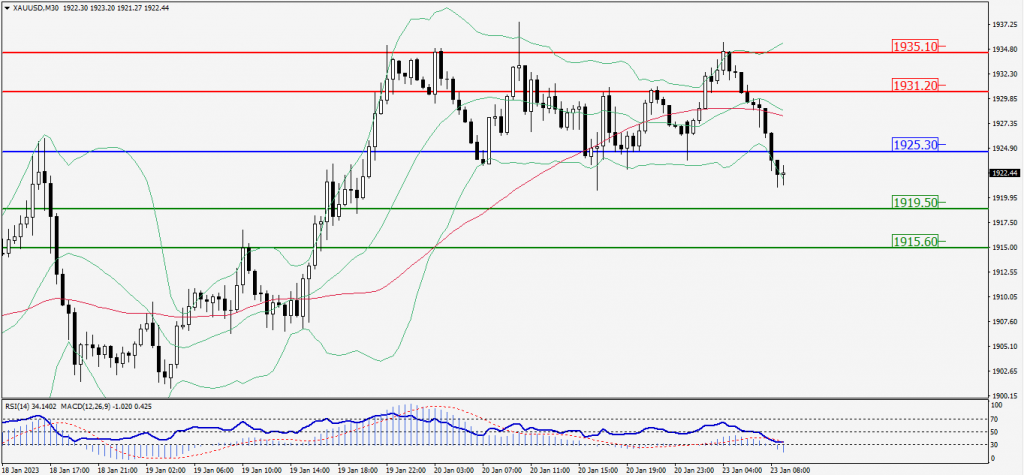
Green Lines Indicate Resistance Levels – Red Lines Indicate Support Levels
Light Blue is a Pivot Point – Black represents the price when the report was produced
Dow Jones Intraday: Trend on the upside
Our pivot point is 33,324.00
Preferable Price Action: Take buy positions up the pivot with targets at 33,505.00 & 33,606.00.
Alternative Price Action: Below 33,324.00 looks for further downside to 33,154.00 & 33,055.00.
Comment: RSI is above 50 levels and Pairs above 55MA.
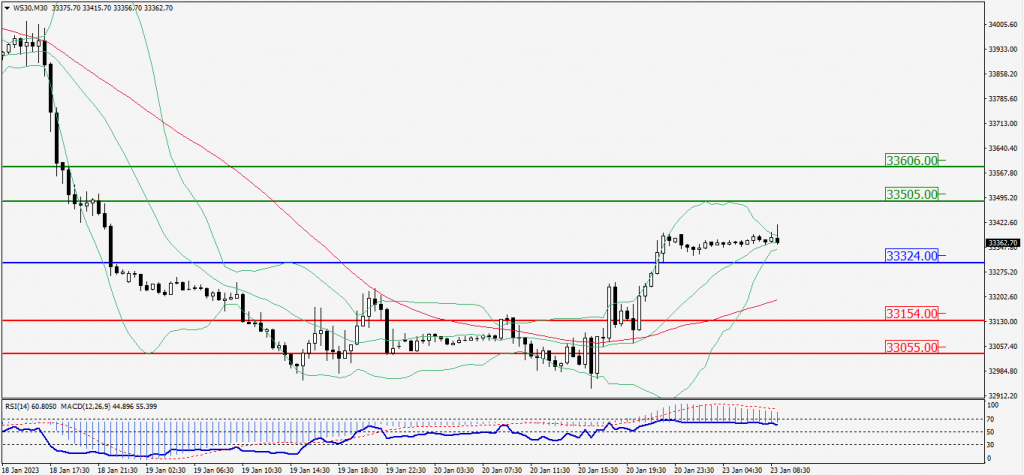
Green Lines Indicate Resistance Levels – Red Lines Indicate Support Levels
Light Blue is a Pivot Point – Black represents the price when the report was produced