Market Wrap: Stocks, Bonds, Commodities
A gauge of global stocks climbed on Thursday while longer-dated US Treasury yields and the dollar fell after a reading of consumer prices fed expectations the Federal Reserve may have the leeway to scale back the size of future interest rate hikes.
The Dow Jones Industrial Average rose 216.96 points to 34,189.97, the S&P 500 gain 0.34% to 3,983.17 and the Nasdaq Composite add 69.43 points to 11,001.11.
MSCI’s index of Asia-Pacific stocks outside Japan is ascend 1.14% to 666.90 levels. The Australian index was higher by 0.66% to 7,328.10. Japanese Nikkei Index lose 1.25% today.
European stocks were positive on Friday, with the Stoxx Europe 50 Index rose 0.66% to 4,126.68, Germany’s DAX gain 0.74% to 15,058.30, and France’s CAC advance 0.74% to 6,975.68, and U.K.’s FTSE 100 add 0.89% to 7,794.04.
Benchmark 10-year U.S. Treasury fell as demand for safe assets ascend again, today 10-year bond yields are positive 0.15% to 3.452.
Oil prices slipped in early trade on Friday but were on track for gains of more than 6% for the week on solid signs of demand growth in top crude oil importer China and expectations of less aggressive interest rate hikes in the United States.
Spot Brent crude oil fell 0.26% to $83.81 per barrel. US West Texas Intermediate crude is down 0.14% to $78.28 a barrel.
The yellow metal gold is decline 0.03% to 1,898.25 dollars per ounce.
Market Wrap: Forex
European stock markets are expected to open slightly higher Friday, with investors focusing on a deluge of important economic data, including U.K. growth data for November, as well as earnings from the U.S. banking sector.
Today, the U.S. dollar index measures the Greenback against a trade-weighted basket of six major currencies, which surge 0.03% to 102.025.
The Euro US Dollar (EUR/USD) is a widely traded pair that is down 0.09% today. This left the pair trading around $1.0836.
The Japanese yen was negative against the U.S. dollar on Friday. Today USD/JPY is drop 0.36% to the 128.75 level.
Another commodity-related currency negative against the U.S dollar, AUD/USD fell 0.10% to 0.6965, and NZD/USD lose 0.30% to 0.6374 level.
EUR/USD Intraday: Trend on the upside
Our pivot point is at 1.08380
Preferable Price Action: Take long positions above pivot level with targets at 1.08830 & 1.09070 in extension.
Alternative Price Action: Below pivot looks for a further downside to 1.07930 & 1.07680.
Comment: RSI is above 50 levels and Pairs above 55MA.
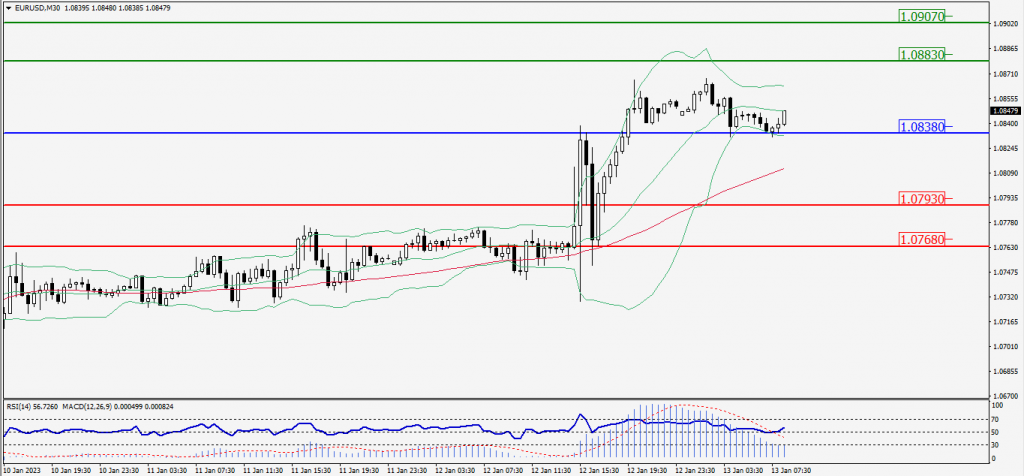
Green Lines Indicate Resistance Levels – Red Lines Indicate Support Levels
Light Blue is a Pivot Point – Black represents the price when the report was produced
GBP/USD Intraday: Support level at 1.22000
Our pivot point is at 1.22000
Preferable Price Action: Buy positions above pivot with targets at 1.22280 & 1.22440 in extension.
Alternative Price Action: The price below pivot would call for further downside to 1.21720 & 1.21540.
Comment: RSI is above 50 levels and Pairs above 55MA.
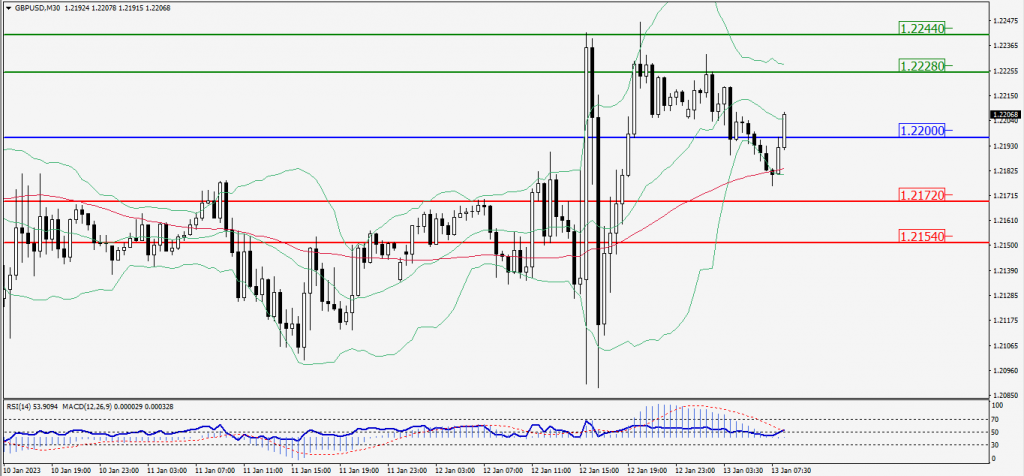
Green Lines Indicate Resistance Levels – Red Lines Indicate Support Levels
Light Blue is a Pivot Point – Black represents the price when the report was produced
USD/JPY Intraday: Major trend on the downside
Our pivot point is at 129.130
Preferable Price Action: Sell position below pivot with the target at 128.100 and 127.470 in extension.
Alternative Price Action: The upside breakout of the pivot would call for 130.200 and 130.860.
Comment: MACD is negative territory and Pairs below its 20MA & 55MA.
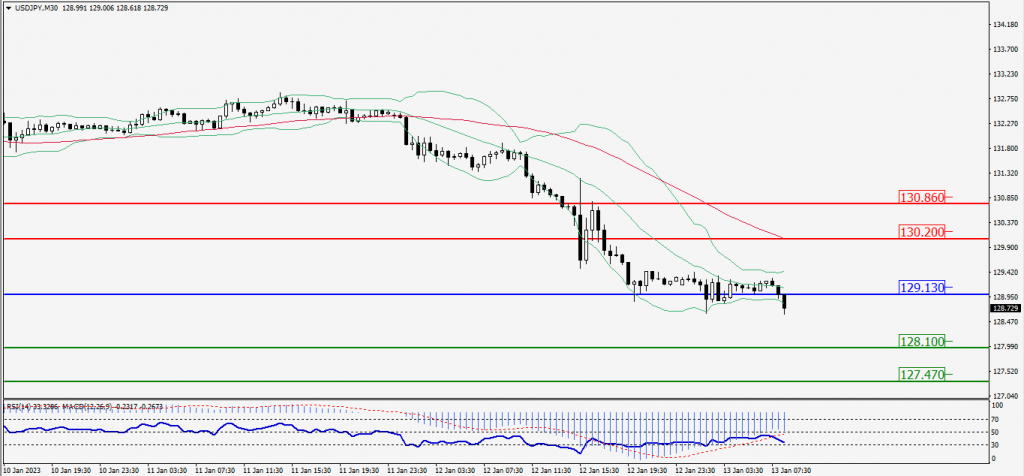
Green Lines Indicate Resistance Levels – Red Lines Indicate Support Levels
Light Blue is a Pivot Point – Black represents the price when the report was produced
AUD/USD Intraday: Trend on the upside
Our pivot point is at 0.69700
Preferable Price Action: Buy positions above pivot with targets at 0.69990 & 0.70210 in extension.
Alternative Price Action: Below pivot looks for a further downside with 0.69410 & 0.69200 as targets.
Comment: RSI is above 50 levels and pairs above its 20MA & 55MA.
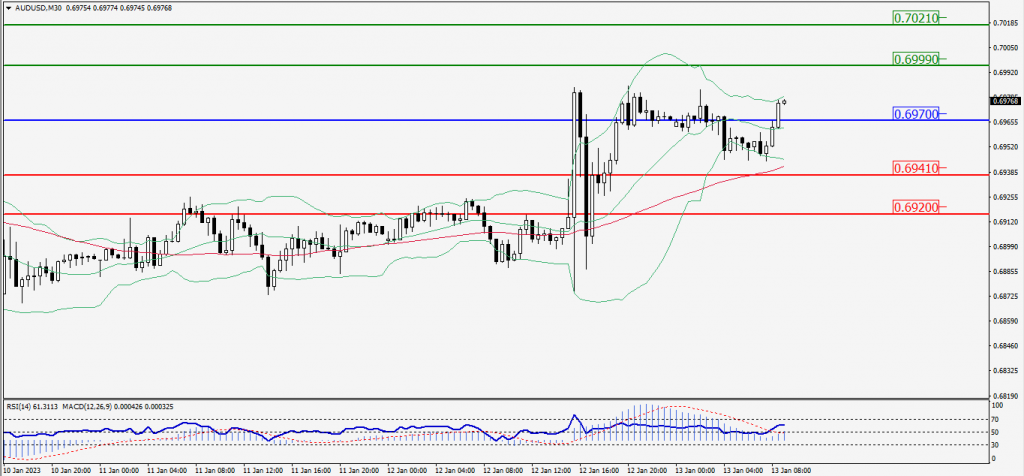
Green Lines Indicate Resistance Levels – Red Lines Indicate Support Levels
Light Blue is a Pivot Point – Black represents the price when the report was produced
CRUDEOIL Intraday: Trend on the upside
Our pivot point is at 78.35
Preferable Price Action: Above pivot buy oil with 79.28 & 79.84 as targets.
Alternative Price Action: Sell crude down pivot with targets at 77.50 and 76.91 in extension.
Comment: MACD is positive territory and Pairs above 55MA.
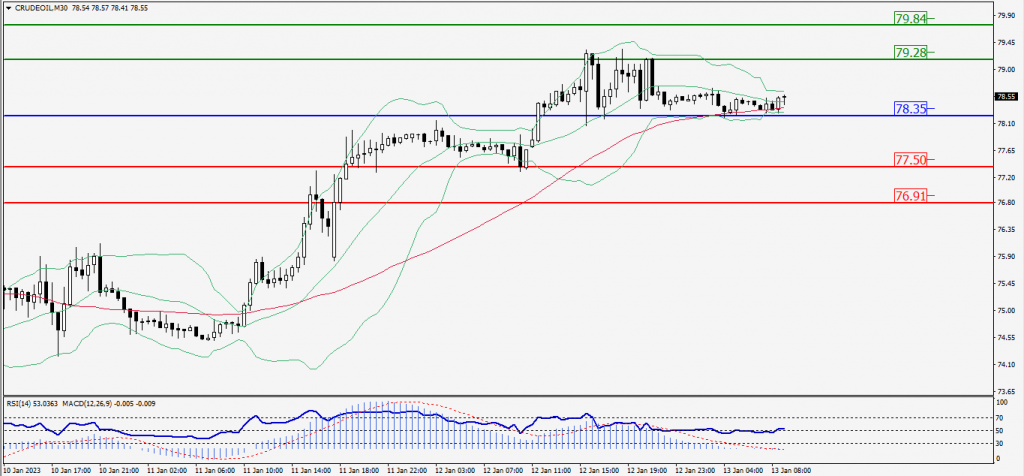
Green Lines Indicate Resistance Levels – Red Lines Indicate Support Levels
Light Blue is a Pivot Point – Black represents the price when the report was produced
XAU/USD Intraday: Trend on the upside
Our pivot point is 1894.90
Preferable Price Action: Further upside to 1902.30 and 1907.10
Alternative Price Action: If the price gives a downside breakout of a pivot, then the price extends to 1887.60 and 1882.90.
Comment: MACD is above 50 level and Pairs above 55MA.
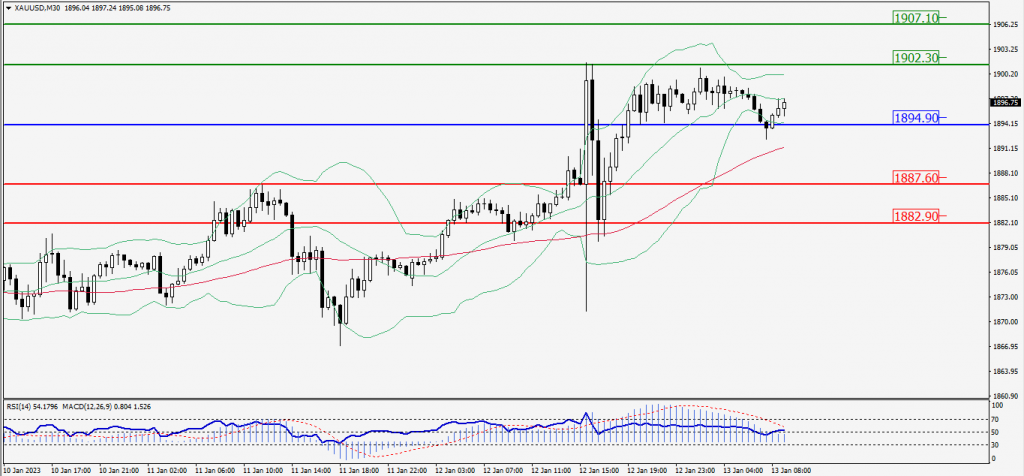
Green Lines Indicate Resistance Levels – Red Lines Indicate Support Levels
Light Blue is a Pivot Point – Black represents the price when the report was produced
Dow Jones Intraday: In a consolidation zone
Our pivot point is 34,101.00
Preferable Price Action: Take sell positions down the pivot with targets at 33,959.00 & 33,856.00.
Alternative Price Action: Above 34,101.00 looks for further upside to 34,254.00 & 34,350.00.
Comment: RSI is at 50 levels and Pairs below 20MA.
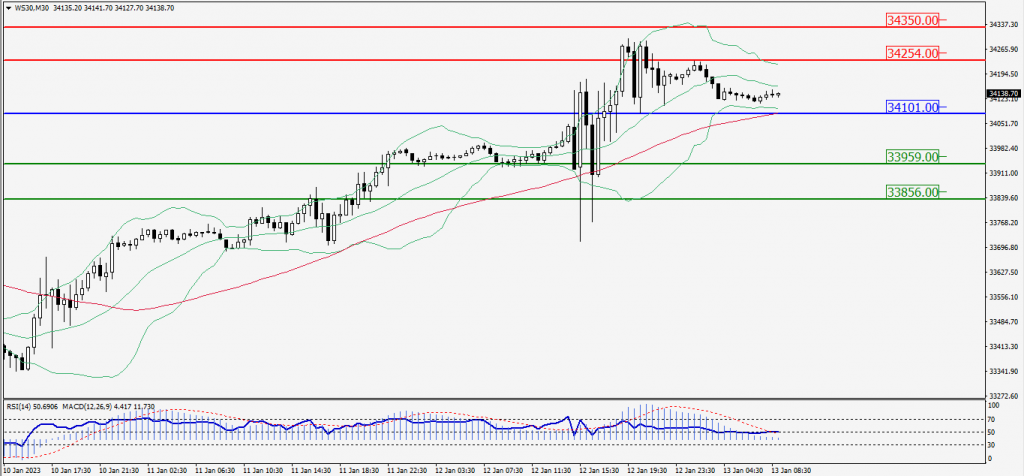
Green Lines Indicate Resistance Levels – Red Lines Indicate Support Levels
Light Blue is a Pivot Point – Black represents the price when the report was produced