Market Wrap: Stocks, Bonds, Commodities
Wall Street’s main indices gained more than 2 percent on Friday after December payrolls expanded more than expected even as wage increases slowed and services activity contracted, easing worries about the Federal Reserve’s interest rate hiking path.
The Dow Jones Industrial Average rose 700.53 points to 33,630.61, the S&P 500 gain 2.28% to 3,895.08 and the Nasdaq Composite add 264.05 points to 10,569.29.
MSCI’s index of Asia-Pacific stocks outside Japan is ascend 2.48% to 657.66 levels. The Australian index was higher by 0.59% to 7,151.30. Japanese Nikkei Index gain 0.59% today.
European stocks were positive on Monday, with the Stoxx Europe 50 Index rose 0.31% to 4,029.45, Germany’s DAX gain 0.24% to 14,644.85, and France’s CAC advance 0.11% to 6,868.19, and U.K.’s FTSE 100 add 0.21% to 7,715.05.
Benchmark 10-year U.S. Treasury fell as demand for safe assets ascend again, today 10-year bond yields are positive 0.87% to 3.602.
Oil prices climbed on Monday as the borders reopened in China, the world’s top crude importer, boosting the outlook for fuel demand growth and offsetting global recession concerns.
Spot Brent crude oil rose 2.48% to $80.54 per barrel. US West Texas Intermediate crude is up 2.68% to $75.75 a barrel.
The yellow metal gold is advance 0.55% to 1,880.00 dollars per ounce.
Market Wrap: Forex
The U.S. dollar was steady on Monday as investors digested a clutch of economic data released last week that stoked hopes of the Federal Reserve slowing the pace of its interest rate hikes.
Today, the U.S. dollar index measures the Greenback against a trade-weighted basket of six major currencies, which slipped 0.31% to 103.330.
The Euro US Dollar (EUR/USD) is a widely traded pair that is up 0.40% today. This left the pair trading around $1.06860.
The Japanese yen was negative against the U.S. dollar on Monday. Today USD/JPY is ascend 0.13% to the 132.24 level.
Another commodity-related currency positive against the U.S dollar, AUD/USD rose 0.79% to 0.69290, and NZD/USD gain 0.79% to 0.63980 level.
EUR/USD Intraday: Trend on the upside
Our pivot point is at 1.06650
Preferable Price Action: Take long positions above pivot level with targets at 1.07200 & 1.07620 in extension.
Alternative Price Action: Below pivot looks for a further downside to 1.06110 & 1.05760.
Comment: RSI above 50 levels and Pairs above its 20MA & 55MA.
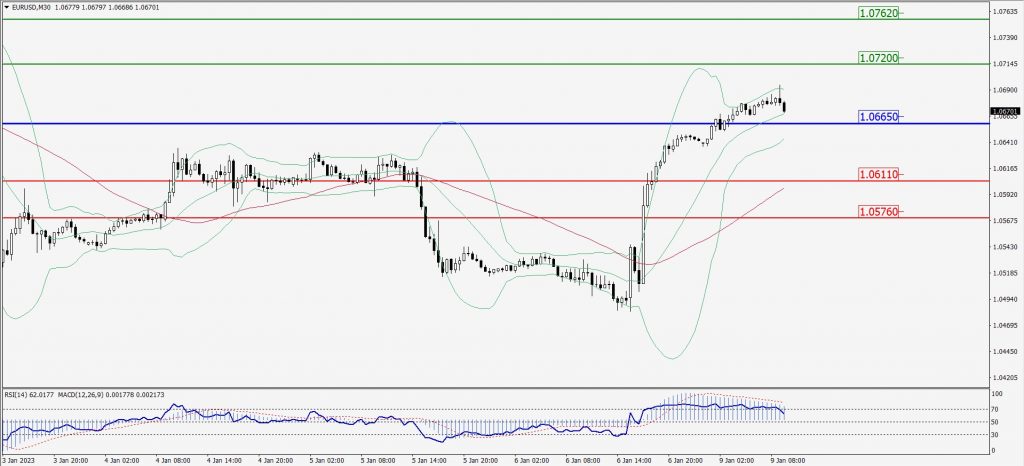
Green Lines Indicate Resistance Levels – Red Lines Indicate Support Levels
Light Blue is a Pivot Point – Black represents the price when the report was produced
GBP/USD Intraday: Major trend on the upside
Our pivot point is at 1.21220
Preferable Price Action: Buy positions above pivot with targets at 1.21810 & 1.22310 in extension.
Alternative Price Action: The price below pivot would call for further downside to 1.20710 & 1.20310.
Comment: RSI is above 50 levels and Pairs above its 20MA & 55MA.
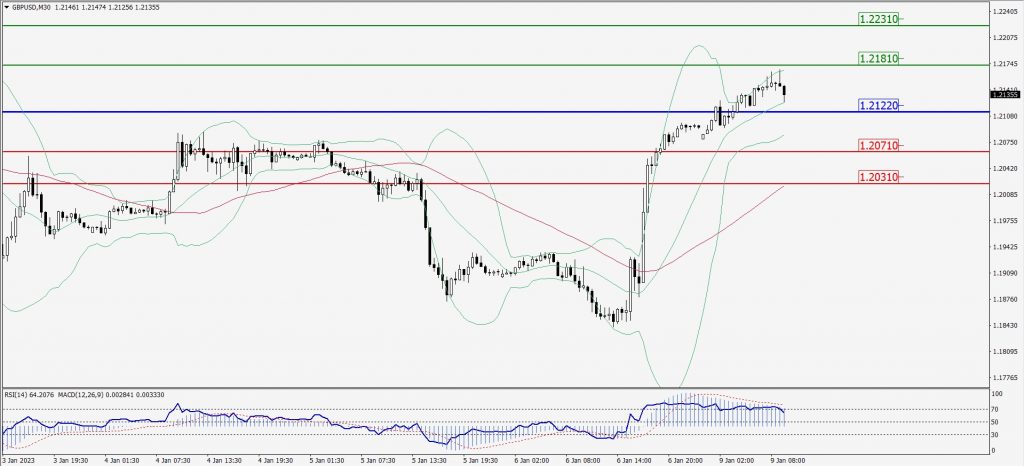
Green Lines Indicate Resistance Levels – Red Lines Indicate Support Levels
Light Blue is a Pivot Point – Black represents the price when the report was produced
USD/JPY Intraday: Support level at 131.970
Our pivot point is at 131.970
Preferable Price Action: Buy position above pivot with the target at 132.640 and 133.220 in extension.
Alternative Price Action: The downside breakout of the pivot would call for 131.310 and 130.820.
Comment: MACD is positive territory and Pairs above 20MA.
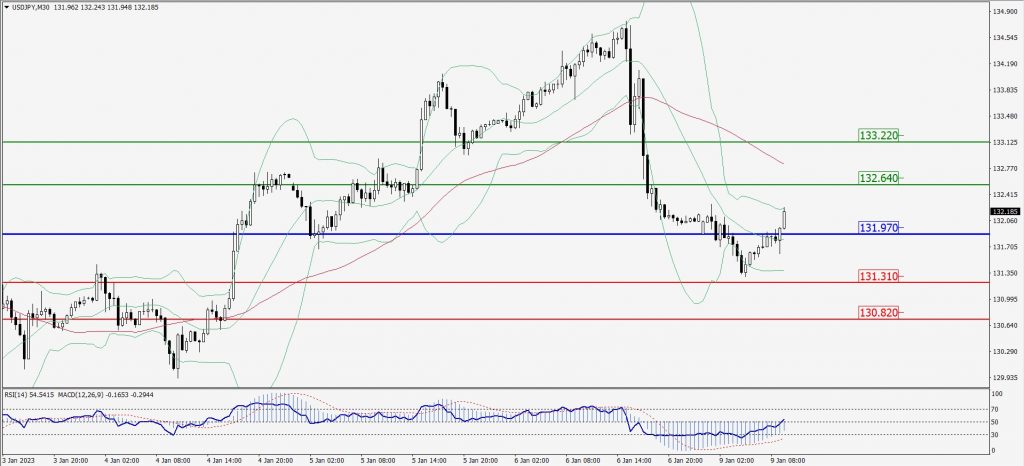
Green Lines Indicate Resistance Levels – Red Lines Indicate Support Levels
Light Blue is a Pivot Point – Black represents the price when the report was produced
AUD/USD Intraday: Trend on the upside
Our pivot point is at 0.68970
Preferable Price Action: Buy Positions above pivot with targets at 0.69660 & 0.70130 in extension.
Alternative Price Action: Below pivot looks for a further downside with 0.68360 & 0.67940 as targets.
Comment: RSI is above 50 levels and pairs above its 20MA & 55MA.
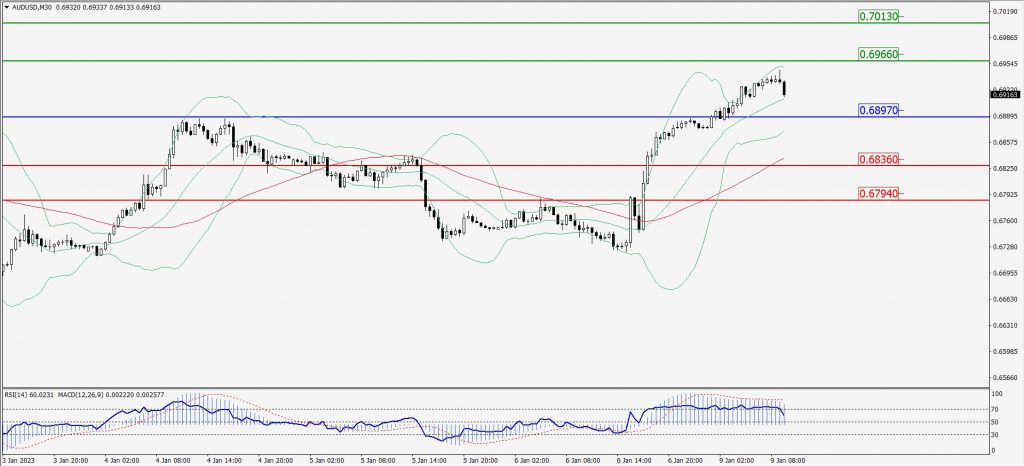
Green Lines Indicate Resistance Levels – Red Lines Indicate Support Levels
Light Blue is a Pivot Point – Black represents the price when the report was produced
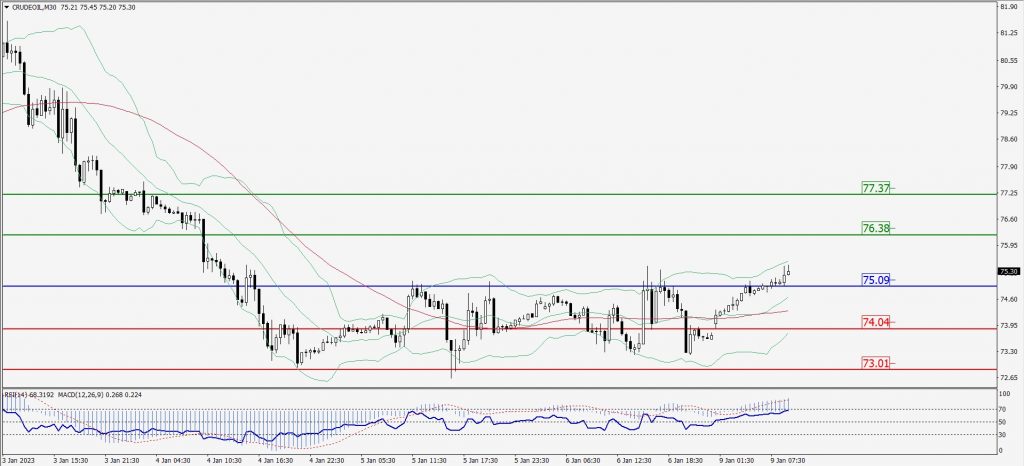
CRUDEOIL Intraday: Support level at 75.09
Our pivot point is at 75.09
Preferable Price Action: Above pivots buy oil with 76.38 & 77.37 as targets.
Alternative Price Action: Sell crude down pivot with targets at 74.04 and 73.01 in extension.
Comment: MACD is positive territory and Pairs above its 20MA & 55MA.
Green Lines Indicate Resistance Levels – Red Lines Indicate Support Levels
Light Blue is a Pivot Point – Black represents the price when the report was produced
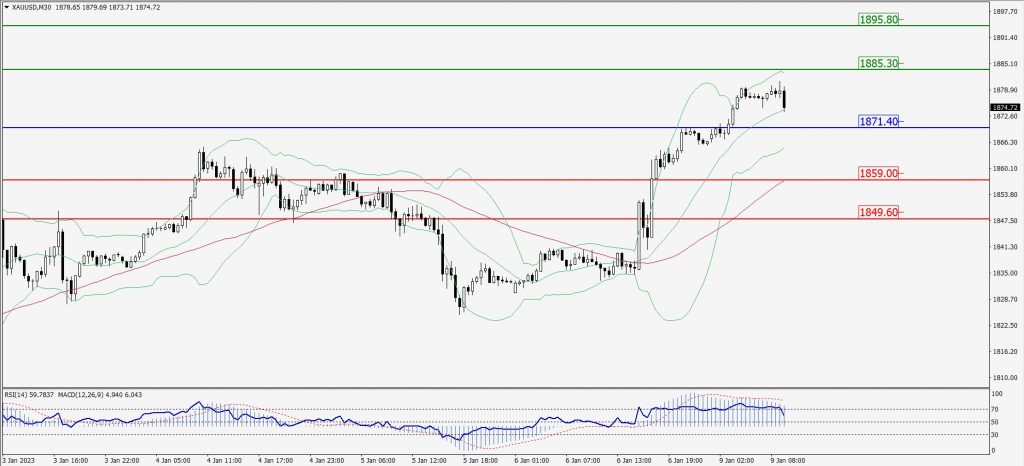
XAU/USD Intraday: Major trend on the upside
Our pivot point is 1871.40
Preferable Price Action: Further upside to 1885.30 and 1895.80
Alternative Price Action: If the price gives a downside breakout of a pivot, then the price extends to 1859.00 and 1849.60.
Comment: MACD is above 50 level and Pairs above 55MA.
Green Lines Indicate Resistance Levels – Red Lines Indicate Support Levels
Light Blue is a Pivot Point – Black represents the price when the report was produced
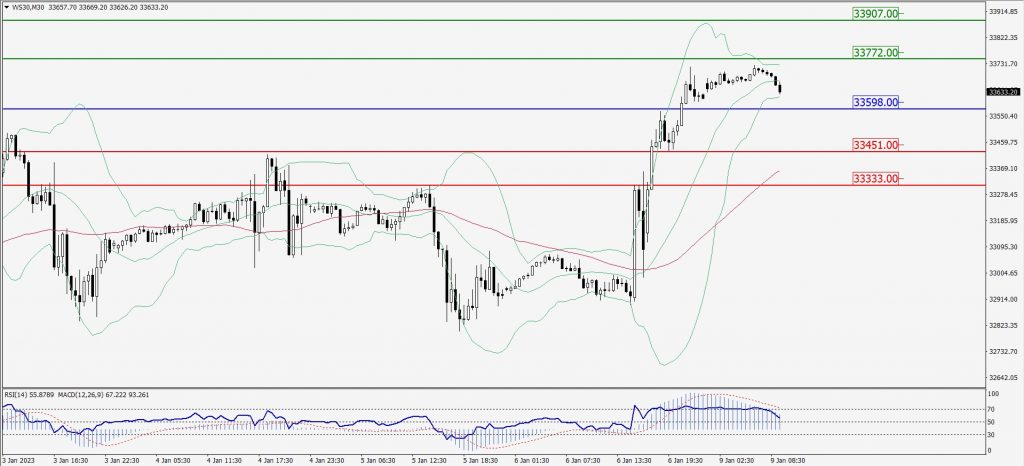
Dow Jones Intraday: Trend on the upside
Our pivot point is 33,598.00
Preferable Price Action: Take buy positions up the pivot with targets at 33,772.00 & 33,907.00.
Alternative Price Action: Below 33,598.00 looks for further downside to 33,451.00 & 33,333.00.
Comment: RSI is above 50 levels and Pairs above 55MA.
Green Lines Indicate Resistance Levels – Red Lines Indicate Support Levels
Light Blue is a Pivot Point – Black represents the price when the report was produced