Market Wrap: Stocks, Bonds, Commodities
Markets in the Asia-Pacific traded lower as most of the region kicks off their first trading sessions for the year.
The Dow Jones Industrial Average fell 73.55 points to 33,147.25, the S&P 500 lose 0.25% to 3,839.50 and the Nasdaq Composite subtract 11.60 points to 10,466.48.
MSCI’s index of Asia-Pacific stocks outside Japan is advance 0.75% to 624.20 levels. The Australian index was lower by 1.31% to 6,946.20. Japanese Nikkei Index gain 0.02% today.
European stocks were positive on Tuesday, with the Stoxx Europe 50 Index rose 0.81% to 3,887.35, Germany’s DAX gain 0.81% to 14,182.65, and France’s CAC advanced 0.69% to 6,639.97, and U.K.’s FTSE 100 add 1.76% to 7,582.90.
Benchmark 10-year U.S. Treasury fell as demand for safe assets ascend again, today 10-year bond yields are negative 0.88% to 3.797.
Oil prices slid on Monday from their highest levels in a month on a stronger dollar and after the head of the International Monetary Fund warned of a tougher 2023 as major economies experience weakening activity.
Spot Brent crude oil rose 0.48% to $86.32 per barrel. US West Texas Intermediate crude is up 0.61% to $80.75 a barrel.
The yellow metal gold is advance 0.97% to 1,843.90 dollars per ounce.
Market Wrap: Forex
European stock markets are expected to open in a mixed fashion Tuesday, as investors fully return from the festive period and digest the economic outlook for the new year.
Today, the U.S. dollar index measures the Greenback against a trade-weighted basket of six major currencies, which surge 0.92% to 104.215.
The Euro US Dollar (EUR/USD) is a widely traded pair that is down 0.82% today. This left the pair trading around $1.0575.
The Japanese yen was negative against the U.S. dollar on Tuesday. Today USD/JPY is drop 0.03% to the 130.68 level.
Another commodity-related currency negative against the U.S dollar, AUD/USD fell 1.08% to 0.6729, and NZD/USD lose 1.05% to 0.6248 level.
EUR/USD Intraday: Trend on the downside
Our pivot point is at 1.06600
Preferable Price Action: Take short positions below pivot level with targets at 1.06420 & 1.06270 in extension.
Alternative Price Action: Above pivot looks for a further upside to 1.06800 & 1.06940.
Comment: RSI below 50 levels and Pairs below it’s 20MA & 55MA.
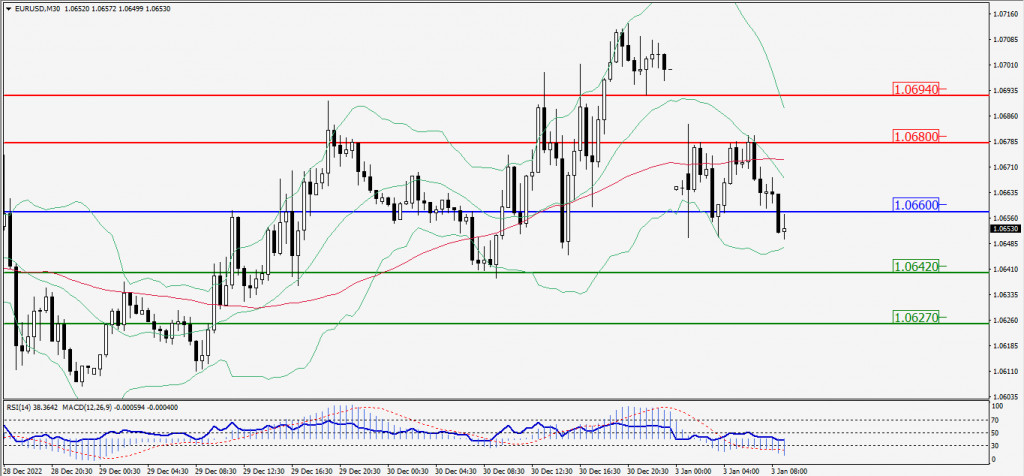
Green Lines Indicate Resistance Levels – Red Lines Indicate Support Levels
Light Blue is a Pivot Point – Black represents the price when the report was produced
GBP/USD Intraday: Major trend on the downside
Our pivot point is at 1.20010
Preferable Price Action: Sell positions below pivot with targets at 1.19070 & 1.18270 in extension.
Alternative Price Action: The price above pivot would call for further upside to 1.20960 & 1.21770.
Comment: RSI is below 50 levels and Pairs below it’s 20MA & 55MA.
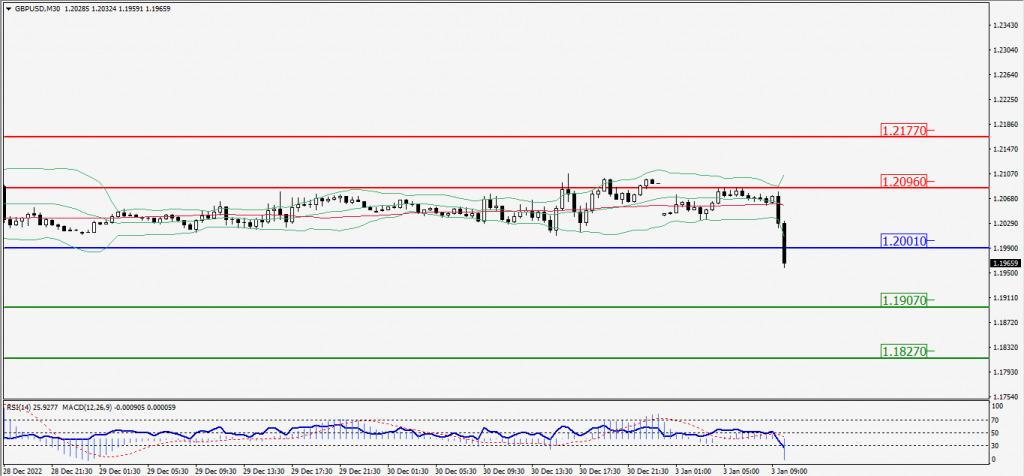
Green Lines Indicate Resistance Levels – Red Lines Indicate Support Levels
Light Blue is a Pivot Point – Black represents the price when the report was produced
USD/JPY Intraday: Resistance level at 130.470
Our pivot point is at 130.470
Preferable Price Action: Sell position below pivot with the target at 129.020 and 127.880 in extension.
Alternative Price Action: The upside breakout of the pivot would call for 131.970 and 133.140.
Comment: MACD is negative territory and Pairs below it’s 20MA & 55MA.
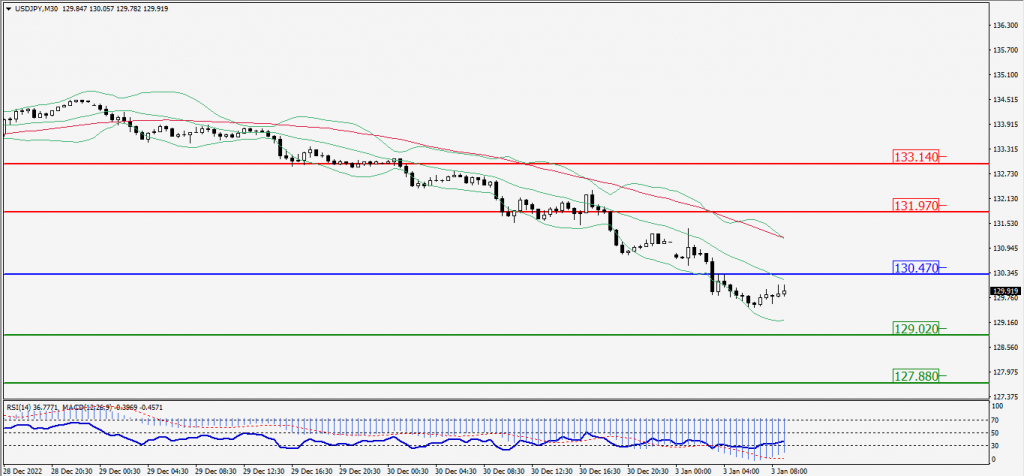
Green Lines Indicate Resistance Levels – Red Lines Indicate Support Levels
Light Blue is a Pivot Point – Black represents the price when the report was produced
AUD/USD Intraday: Trend on the downside
Our pivot point is at 0.67940
Preferable Price Action: Sell Positions below pivot with targets at 0.67750 & 0.67600 in extension.
Alternative Price Action: Above pivot looks for a further upside with 0.68130 & 0.68280 as targets.
Comment: RSI is below 50 levels and pairs below 20MA.
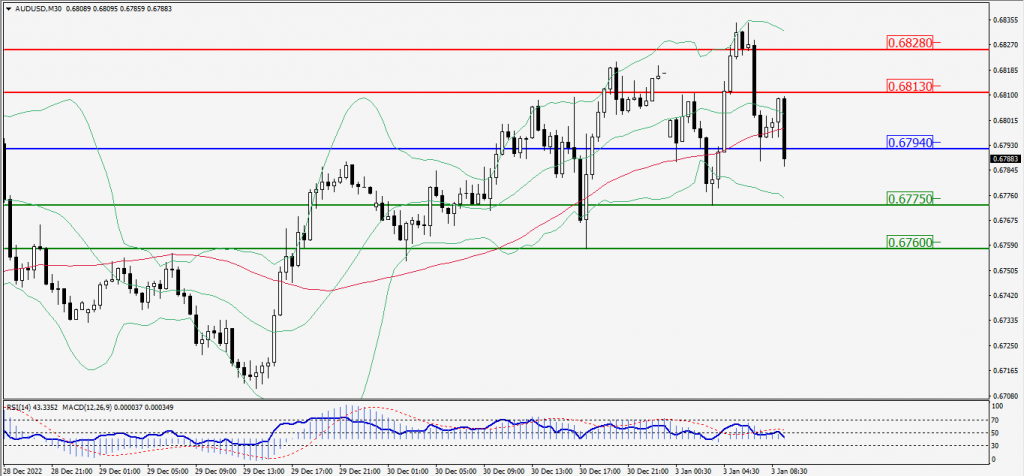
Green Lines Indicate Resistance Levels – Red Lines Indicate Support Levels
Light Blue is a Pivot Point – Black represents the price when the report was produced
CRUDEOIL Intraday: Major trend on the upside
Our pivot point is at 80.68
Preferable Price Action: Above pivots buy oil with 82.19 & 83.18 as targets.
Alternative Price Action: Sell crude down pivot with targets at 79.17 and 78.11 in extension.
Comment: MACD is positive territory and Pairs above it’s 20MA & 55MA.
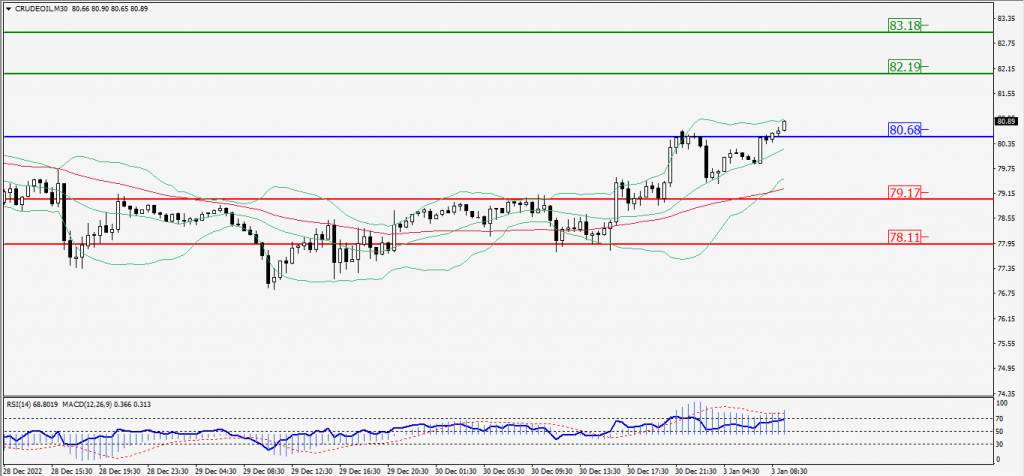
Green Lines Indicate Resistance Levels – Red Lines Indicate Support Levels
Light Blue is a Pivot Point – Black represents the price when the report was produced
XAU/USD Intraday: Major trend on the upside
Our pivot point is 1843.90
Preferable Price Action: Further upside to 18590.30 and 1870.60
Alternative Price Action: If the price gives an downside breakout of a pivot, then the price extends to 1829.10 and 1817.60.
Comment: MACD is above 50 level and Pairs above it’s 20MA & 55MA.
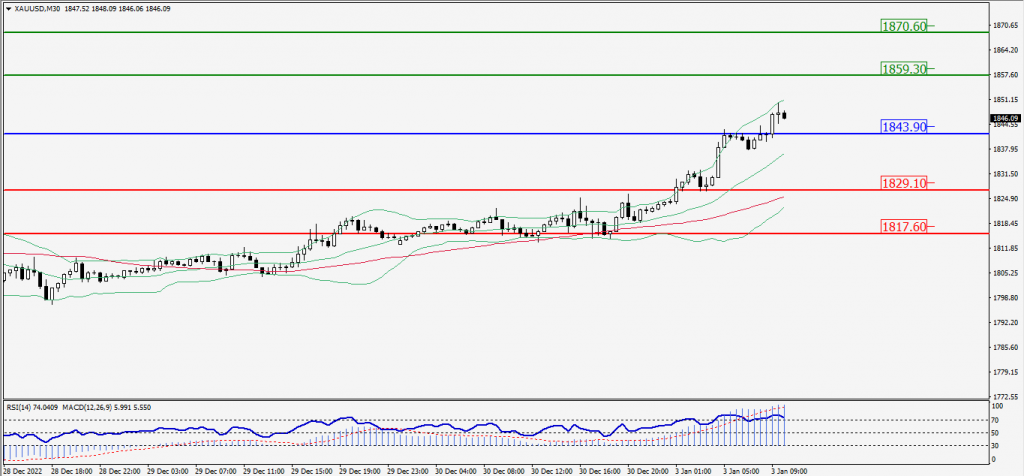
Green Lines Indicate Resistance Levels – Red Lines Indicate Support Levels
Light Blue is a Pivot Point – Black represents the price when the report was produced
Dow Jones Intraday: Trend on the upside
Our pivot point is 33,280.00
Preferable Price Action: Take buy positions up the pivot with targets at 33,417.00 & 33,527.00.
Alternative Price Action: Below 33,280.00 looks for further downside to 33,144.00 & 33,033.00.
Comment: RSI is above 50 levels and Pairs above it’s 20MA & 55MA.
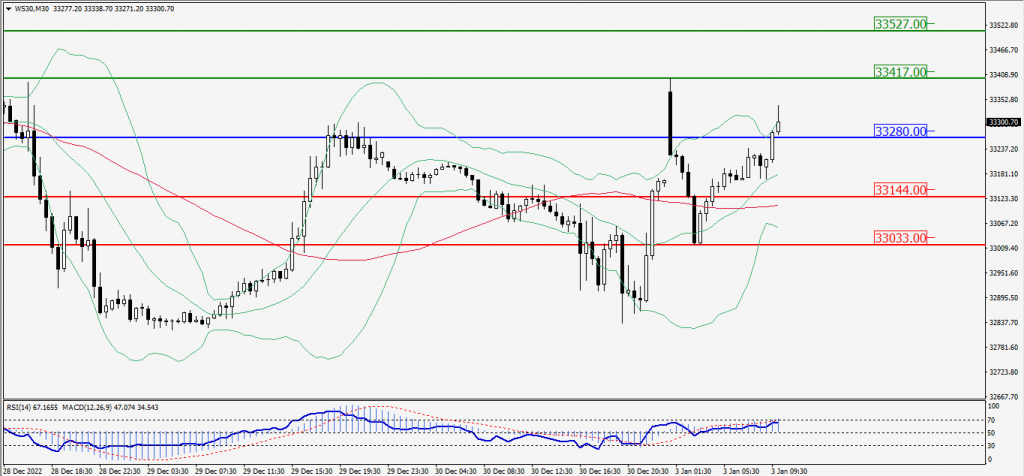
Green Lines Indicate Resistance Levels – Red Lines Indicate Support Levels
Light Blue is a Pivot Point – Black represents the price when the report was produced