Market Wrap: Stocks, Bonds, Commodities
Wall Street’s major averages closed lower on Thursday with technology-heavy Nasdaq’s 2 percent drop leading losses as investors worried that data showing a resilient economy would lead the US Federal Reserve to keep hiking interest rates for longer than feared.
The Dow Jones Industrial Average fell 348.99 points to 33,027.49, the S&P 500 lose 1.45% to 3,822.39 and the Nasdaq Composite subtract 233.25 points to 10,476.12.
MSCI’s index of Asia-Pacific stocks outside Japan is decline 1.08% to 617.79 levels. The Australian index was lower by 0.63% to 7,107.70. Japanese Nikkei Index lose 1.03% today.
European stocks were negative on Friday, with the Stoxx Europe 50 Index fell 1.26% to 3,823.29, Germany’s DAX lose 1.30% to 13,914.07, and France’s CAC decline 0.95% to 6,517.97, and U.K.’s FTSE 100 subtract 0.37% to 7,469.28.
Benchmark 10-year U.S. Treasury fell as demand for safe assets ascend again, today 10-year bond yields are positive 0.45% to 3.687.
Oil fell by around $1 a barrel on Thursday in volatile trade as the impact of tighter US crude stocks due to a winter storm in the United States was outweighed by fears that Federal Reserve interest rate hikes and China’s rising Covid-19 cases would dent demand.
Spot Brent crude oil rose 1.58% to $82.26 per barrel. US West Texas Intermediate crude is up 1.07% to $78.32 a barrel.
The yellow metal gold is advance 0.49% to 1,804.10 dollars per ounce.
Market Wrap: Forex
European stock markets are expected to open higher Friday in thin holiday-affected volumes ahead of the release of more regional growth, inflation, and confidence data.
Today, the U.S. dollar index measures the Greenback against a trade-weighted basket of six major currencies, which surge 0.13% to 103.993.
The Euro US Dollar (EUR/USD) is a widely traded pair that is up 0.21% today. This left the pair trading around $1.0615.
The Japanese yen was positive against the U.S. dollar on Friday. Today USD/JPY is ascend 0.19% to the 132.57 level.
Another commodity-related currency positive against the U.S dollar, AUD/USD rose 0.38% to 0.6691, and NZD/USD gain 0.71% to 0.6281 level.
EUR/USD Intraday: Trend on the upside
Our pivot point is at 1.06040
Preferable Price Action: Take long positions above pivot level with targets at 1.06190 & 1.06300 in extension.
Alternative Price Action: Below pivot looks for a further downside to 1.05900 & 1.05790.
Comment: RSI above 50 levels and Pairs above 20MA.
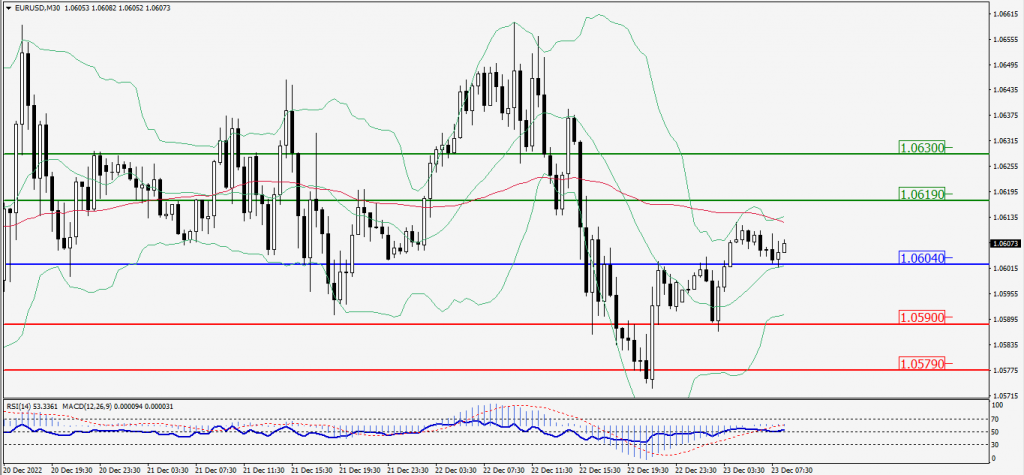
Green Lines Indicate Resistance Levels – Red Lines Indicate Support Levels
Light Blue is a Pivot Point – Black represents the price when the report was produced
GBP/USD Intraday: Resistance level at the 1.20560
Our pivot point is at 1.20560.
Preferable Price Action: Sell positions below pivot with targets at 1.20170 & 1.19850 in extension.
Alternative Price Action: The price above pivot would call for further upside to 1.20940 & 1.21260.
Comment: RSI is below 50 levels and Pairs below 55MA.
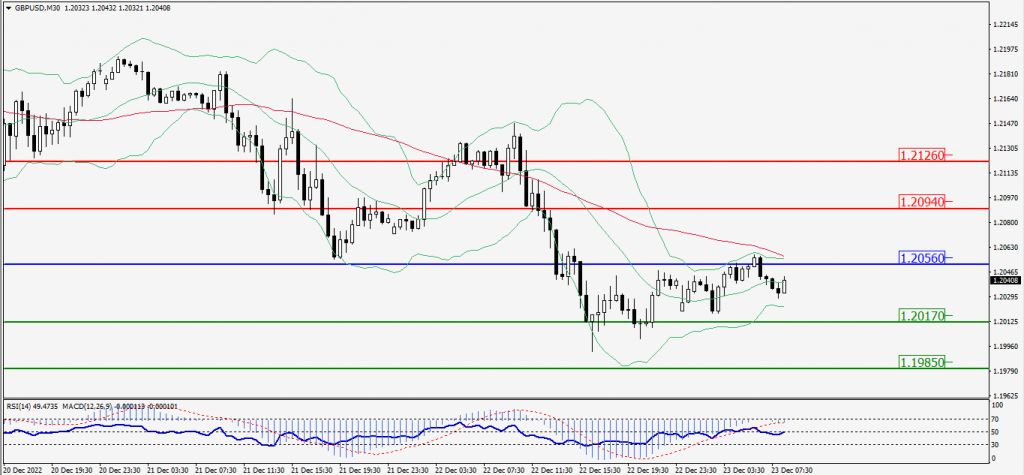
Green Lines Indicate Resistance Levels – Red Lines Indicate Support Levels
Light Blue is a Pivot Point – Black represents the price when the report was produced
USD/JPY Intraday: Major trend on the upside
Our pivot point is at 132.570
Preferable Price Action: Buy position above pivot with the target at 133.180 and 133.670 in extension.
Alternative Price Action: The downside breakout of the pivot would call for 131.930 and 131.410.
Comment: MACD is positive territory and Pairs above 20MA & 55MA.
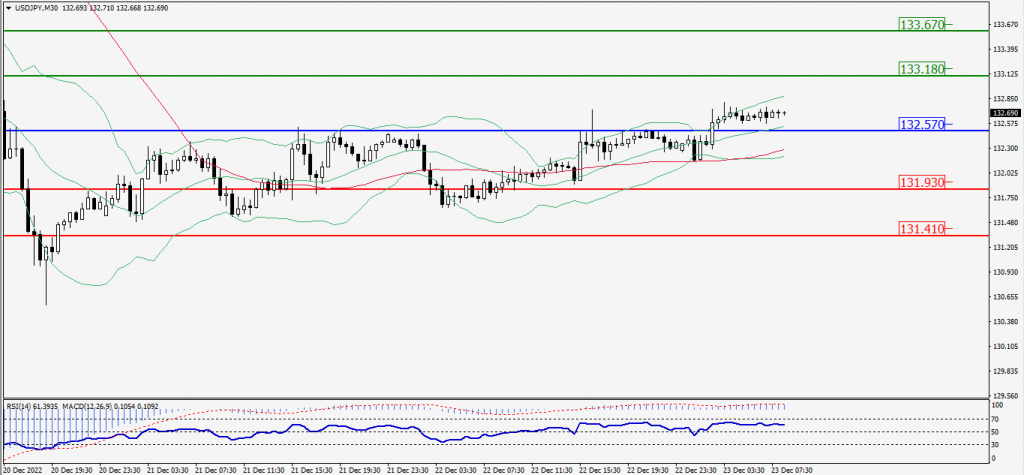
Green Lines Indicate Resistance Levels – Red Lines Indicate Support Levels
Light Blue is a Pivot Point – Black represents the price when the report was produced
AUD/USD Intraday: Support level at the 0.66890
Our pivot point is at 0.66890
Preferable Price Action: Buy Positions above pivot with targets at 0.67110 & 0.67270 in extension.
Alternative Price Action: Below pivot looks for a further downside with 0.66680 & 0.66520 as targets.
Comment: RSI is above 50 levels and pairs above 20MA.
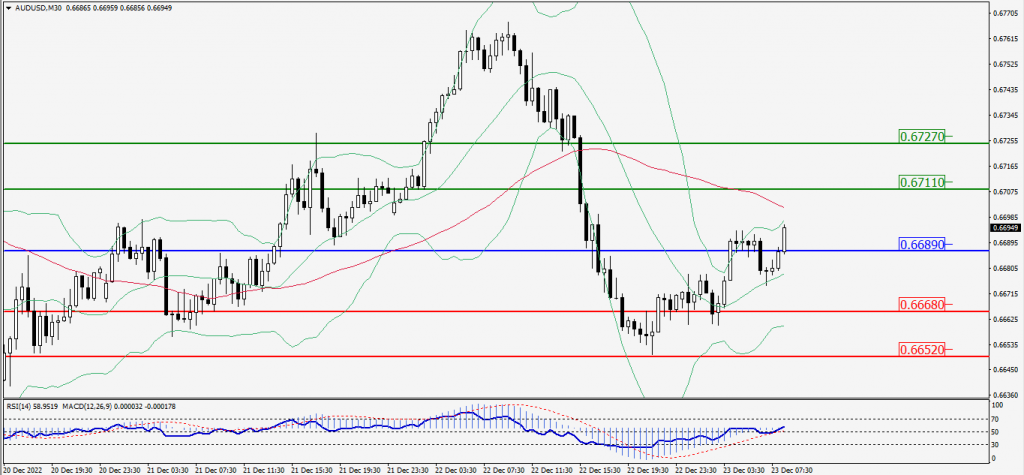
Green Lines Indicate Resistance Levels – Red Lines Indicate Support Levels
Light Blue is a Pivot Point – Black represents the price when the report was produced
CRUDEOIL Intraday: Trend on the downside
Our pivot point is at 78.49.
Preferable Price Action: Below pivots sell oil with 77.35 & 76.50 as targets.
Alternative Price Action: Buy crude up pivot with targets at 79.60 and 80.44 in extension.
Comment: MACD is negative territory and Pairs below 55MA.
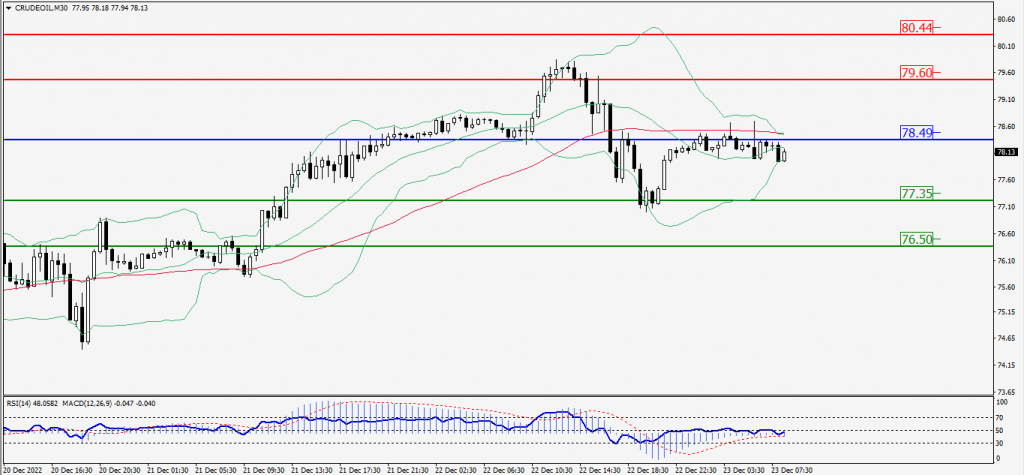
Green Lines Indicate Resistance Levels – Red Lines Indicate Support Levels
Light Blue is a Pivot Point – Black represents the price when the report was produced
XAU/USD Intraday: In a consolidation zone
Our pivot point is 1798.70
Preferable Price Action: Further downside to 1790.50 and 1783.90
Alternative Price Action: If the price gives an upside breakout of a pivot, then the price extends to 1806.90 and 1813.30.
Comment: MACD is at 50 level and Pairs below 55MA.
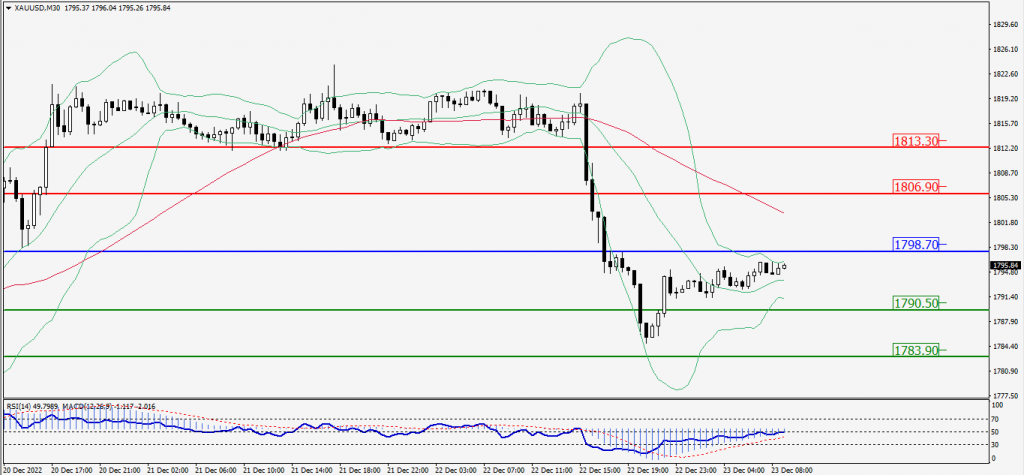
Green Lines Indicate Resistance Levels – Red Lines Indicate Support Levels
Light Blue is a Pivot Point – Black represents the price when the report was produced
Dow Jones Intraday: Trend on the upside
Our pivot point is 33,051.00
Preferable Price Action: Take buy positions up the pivot with targets at 33,214.00 & 33,350.00.
Alternative Price Action: Below 33,051.00 looks for further downside to 32,893.00 & 32,755.00.
Comment: RSI is above 50 levels and Pairs above 20MA.
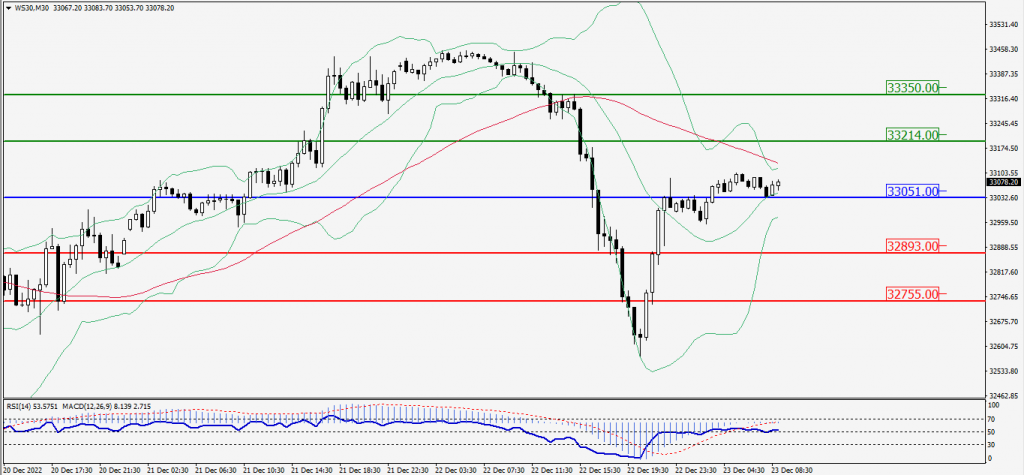
Green Lines Indicate Resistance Levels – Red Lines Indicate Support Levels
Light Blue is a Pivot Point – Black represents the price when the report was produced