Market Wrap: Stocks, Bonds, Commodities
Wall Street’s three main stock indices closed higher on Wednesday for their biggest daily gains so far in December with help from upbeat Nike and FedEx quarterly earnings, as well as improving consumer confidence and easing inflation expectations from investors.
The Dow Jones Industrial Average rose 526.74 points to 33,376.48, the S&P 500 gain 1.49% to 3,878.44 and the Nasdaq Composite add 162.26 points to 10,709.37.
MSCI’s index of Asia-Pacific stocks outside Japan is advance 1.44% to 624.54 levels. The Australian index was higher by 37.40% to 7,152.50. Japanese Nikkei Index gain 0.46% today.
European stocks were positive on Thursday, with the Stoxx Europe 50 Index rose 1.83% to 3,872.15, Germany’s DAX gain 1.54% to 14,097.82, and France’s CAC advance 2.01% to 6,580.24, and U.K.’s FTSE 100 add 1.72% to 7,497.32.
Benchmark 10-year U.S. Treasury fell as demand for safe assets ascend again, today 10-year bond yields are negative 0.95% to 3.649.
Oil prices rose by more than $2 a barrel on Wednesday after data showed a larger-than-expected draw in US crude stockpiles, but gains were capped by a snowstorm that is expected to hit US travel.
Spot Brent crude oil rose 0.29% to $82.44 per barrel. US West Texas Intermediate crude is up 0.37% to $78.58 a barrel.
The yellow metal gold is decline 0.10% to 1,823.65 dollars per ounce.
Market Wrap: Forex
European stock markets are expected to open marginally higher Thursday, as investors digest the latest growth data from the U.K. while attempting to end the year on a positive note.
Today, the U.S. dollar index measures the Greenback against a trade-weighted basket of six major currencies, which surge 0.22% to 103.615.
The Euro US Dollar (EUR/USD) is a widely traded pair that is up 0.32% today. This left the pair trading around $1.0637.
The Japanese yen was negative against the U.S. dollar on Thursday. Today USD/JPY is drop 0.43% to the 131.91 level.
Another commodity-related currency positive against the U.S dollar, AUD/USD rose 0.84% to 0.6763, and NZD/USD gain 0.57% to 0.6328 level.
EUR/USD Intraday: Major trend on the upside
Our pivot point is at 1.06430
Preferable Price Action: Take long positions above pivot level with targets at 1.06700 & 1.06910 in extension.
Alternative Price Action: Below pivot looks for a further downside to 1.06190 & 1.05980.
Comment: RSI above 50 levels and Pairs above 20MA & 55MA.
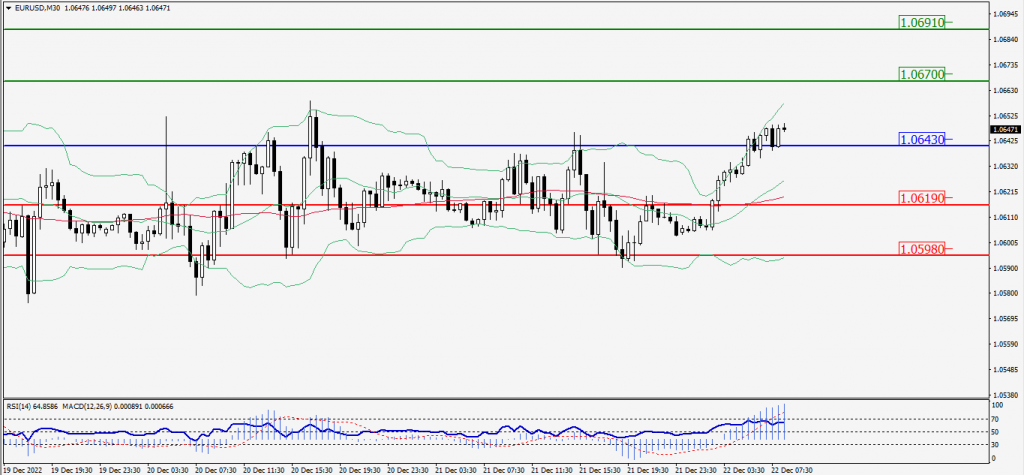
Green Lines Indicate Resistance Levels – Red Lines Indicate Support Levels
Light Blue is a Pivot Point – Black represents the price when the report was produced
GBP/USD Intraday: Support level at the 1.21200
Our pivot point is at 1.21200.
Preferable Price Action: Buy positions above pivot with targets at 1.21500 & 1.21700 in extension.
Alternative Price Action: The price below pivot would call for further downside to 1.20920 & 1.20730.
Comment: RSI is above 50 levels and Pairs above 20MA & 55MA.
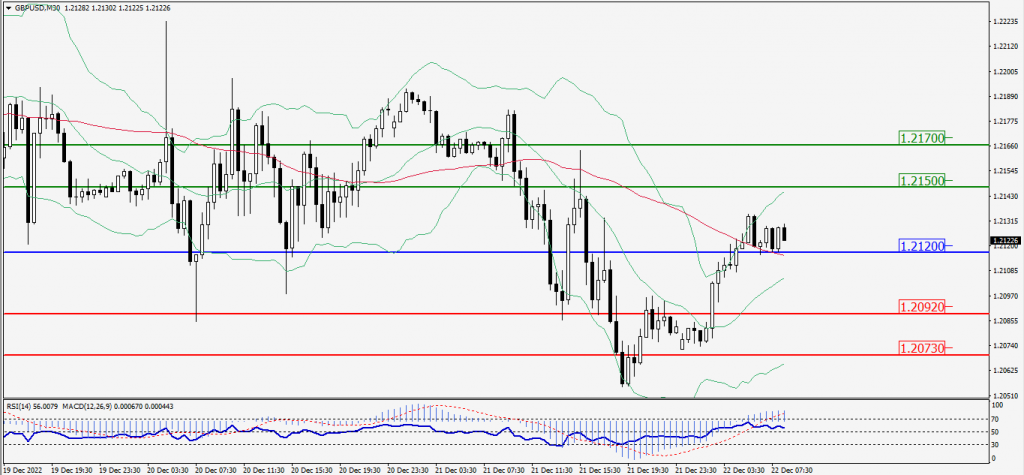
Green Lines Indicate Resistance Levels – Red Lines Indicate Support Levels
Light Blue is a Pivot Point – Black represents the price when the report was produced
USD/JPY Intraday: Trend on the downside
Our pivot point is at 132.260
Preferable Price Action: Sell position below pivot with the target at 130.940 and 130.020 in extension.
Alternative Price Action: The upside breakout of the pivot would call for 133.550 and 134.460.
Comment: MACD is negative territory and Pairs below 20MA & 55MA.
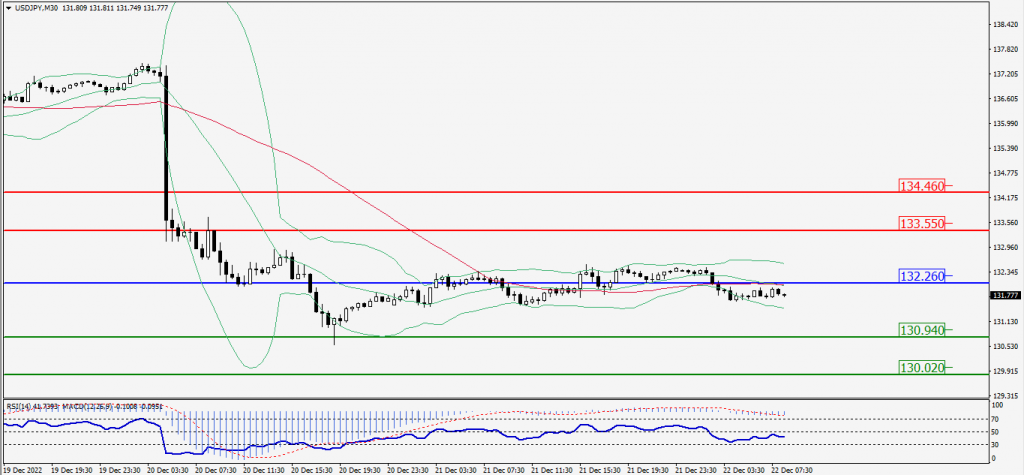
Green Lines Indicate Resistance Levels – Red Lines Indicate Support Levels
Light Blue is a Pivot Point – Black represents the price when the report was produced
AUD/USD Intraday: Major trend on the upside
Our pivot point is at 0.67520
Preferable Price Action: Buy Positions above pivot with targets at 0.68010 & 0.68370 in extension.
Alternative Price Action: Below pivot looks for a further downside with 0.67090 & 0.66730 as targets.
Comment: RSI is above 50 levels and pairs above 20MA & 55MA.
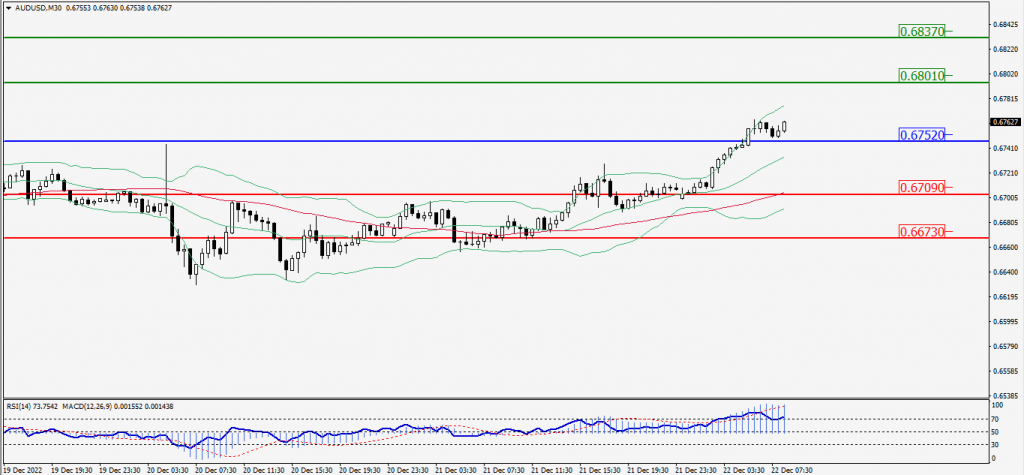
Green Lines Indicate Resistance Levels – Red Lines Indicate Support Levels
Light Blue is a Pivot Point – Black represents the price when the report was produced
CRUDEOIL Intraday: Trend on the upside
Our pivot point is at 78.22.
Preferable Price Action: Above pivots buy oil with 79.58 & 80.57 as targets.
Alternative Price Action: Sell crude down pivot with targets at 76.89 and 75.98 in extension.
Comment: MACD is positive territory and Pairs above 55MA.
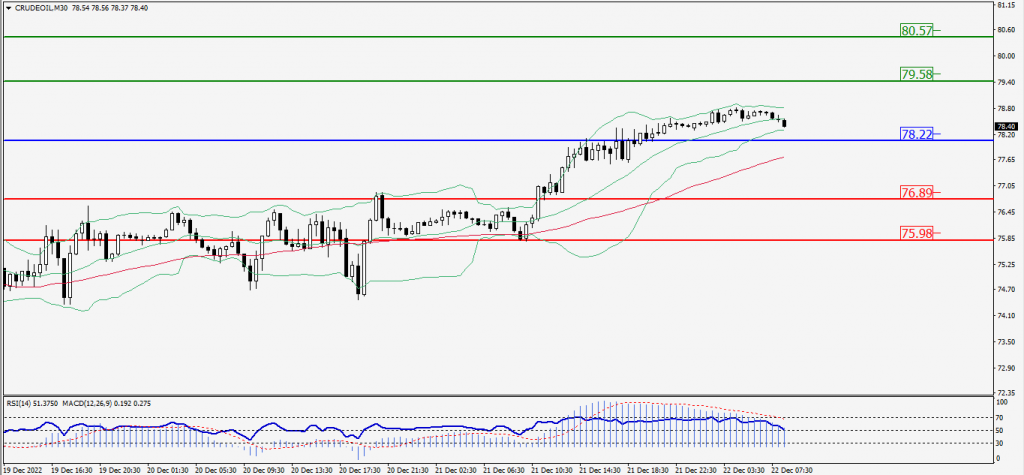
Green Lines Indicate Resistance Levels – Red Lines Indicate Support Levels
Light Blue is a Pivot Point – Black represents the price when the report was produced
XAU/USD Intraday: Major trend on the downside
Our pivot point is 1819.00
Preferable Price Action: Further downside to 1809.50 and 1801.90
Alternative Price Action: If the price gives an upside breakout of a pivot, then the price extends to 1828.20 and 1835.80.
Comment: MACD is negative territory and Pairs below 20MA & 55MA.
Green Lines Indicate Resistance Levels – Red Lines Indicate Support Levels
Light Blue is a Pivot Point – Black represents the price when the report was produced
Dow Jones Intraday: Trend on the upside
Our pivot point is 33,345.00
Preferable Price Action: Take buy positions up the pivot with targets at 33,599.00 & 33,754.00.
Alternative Price Action: Below 33,345.00 looks for further downside to 33,110.00 & 32,948.00.
Comment: RSI is above 50 levels and Pairs above 55MA.
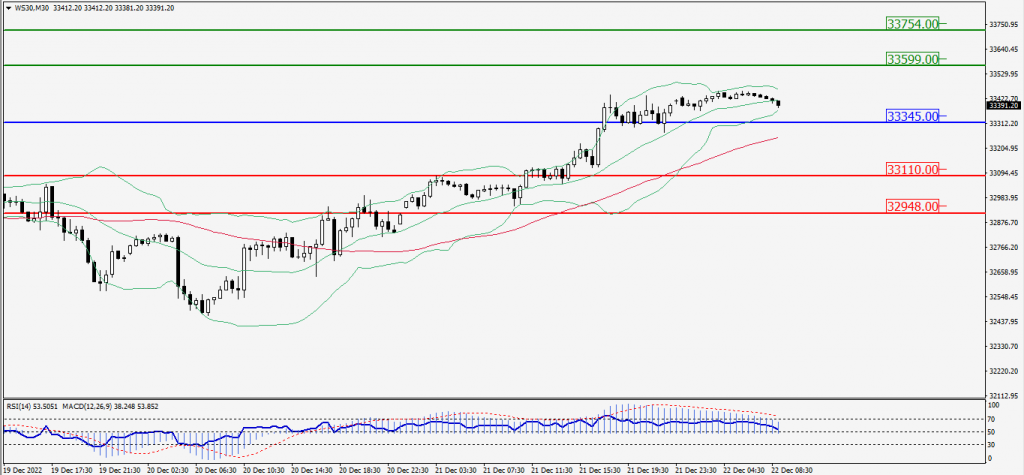
Green Lines Indicate Resistance Levels – Red Lines Indicate Support Levels
Light Blue is a Pivot Point – Black represents the price when the report was produced