Market Wrap: Stocks, Bonds, Commodities
US stock indices closed sharply lower on Thursday, with each of the major averages suffering their biggest daily percentage drop in weeks, as fears intensified that the Federal Reserve’s battle against inflation using aggressive interest rate hikes could lead to a recession.
The Dow Jones Industrial Average fell 764.13 points to 33,202.22, the S&P 500 lose 2.49% to 3,895.75 and the Nasdaq Composite subtract 360.36 points to 10,810.53.
MSCI’s index of Asia-Pacific stocks outside Japan is decline 0.17% to 624.95 levels. The Australian index was lower by 0.78% to 7,148.70. Japanese Nikkei Index lose 1.87% today.
European stocks were negative on Friday, with the Stoxx Europe 50 Index fell 3.51% to 3,835.70, Germany’s DAX lose 3.28% to 13,986.23, and France’s CAC decline 3.09% to 6,522.77, and U.K.’s FTSE 100 subtract 0.93% to 7,426.17.
Benchmark 10-year U.S. Treasury fell as demand for safe assets ascend again, today 10-year bond yields are positive 1.04% to 3.486.
Oil prices slid about 2 percent on Thursday as traders worried about the fuel demand outlook due to a stronger dollar and further interest rate hikes by global central banks.
Spot Brent crude oil fell 0.26% to $81.00 per barrel. US West Texas Intermediate crude is down 0.39% to $75.81 a barrel.
The yellow metal gold is advance 0.02% to 1,787.85 dollars per ounce.
Market Wrap: Forex
European stock markets are expected to open marginally higher Friday, rebounding after the previous session’s selloff in the wake of the ECB’s hawkish message, ahead of the release of a batch of important economic data.
Today, the U.S. dollar index measures the Greenback against a trade-weighted basket of six major currencies, which slipped 0.10% to 104.095.
The Euro US Dollar (EUR/USD) is a widely traded pair that is up 0.13% today. This left the pair trading around $1.0640.
The Japanese yen was negative against the U.S. dollar on Friday. Today USD/JPY is drop 0.37% to the 137.25 level.
Another commodity-related currency mixed against the U.S dollar, AUD/USD fell 0.04% to 0.6699, and NZD/USD gain 0.22% to 0.6358 level.
EUR/USD Intraday: Major trend on the upside
Our pivot point is at 1.06540
Preferable Price Action: Take long positions above pivot level with targets at 1.06850 & 1.07030 in extension.
Alternative Price Action: Below pivot looks for a further downside to 1.06240 & 1.06050.
Comment: RSI above 50 levels and Pairs above 20MA & 55MA.
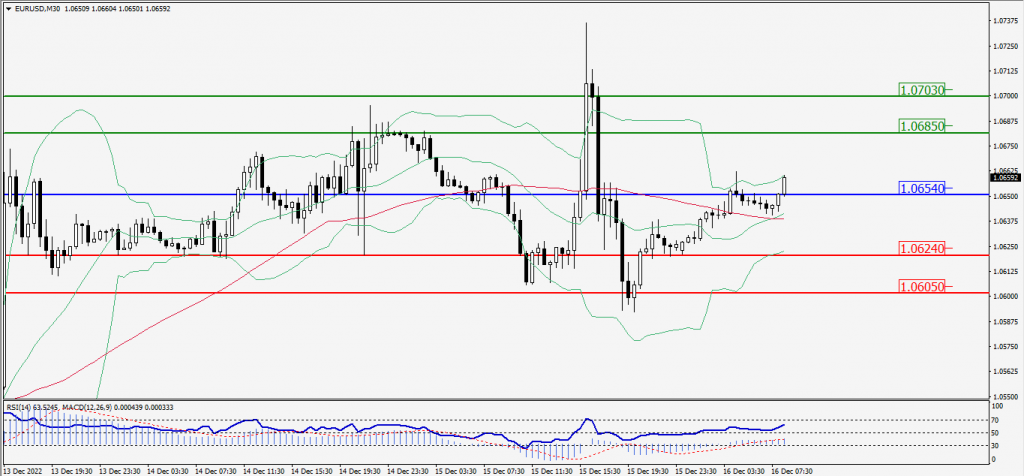
Green Lines Indicate Resistance Levels – Red Lines Indicate Support Levels
Light Blue is a Pivot Point – Black represents the price when the report was produced
GBP/USD Intraday: Support level at 1.22090
Our pivot point is at 1.22090.
Preferable Price Action: Buy positions above pivot with targets at 1.22810 & 1.23230 in extension.
Alternative Price Action: The price below pivot would call for further downside to 1.21380 & 1.20960.
Comment: RSI is above 50 levels and Pairs above 20MA.
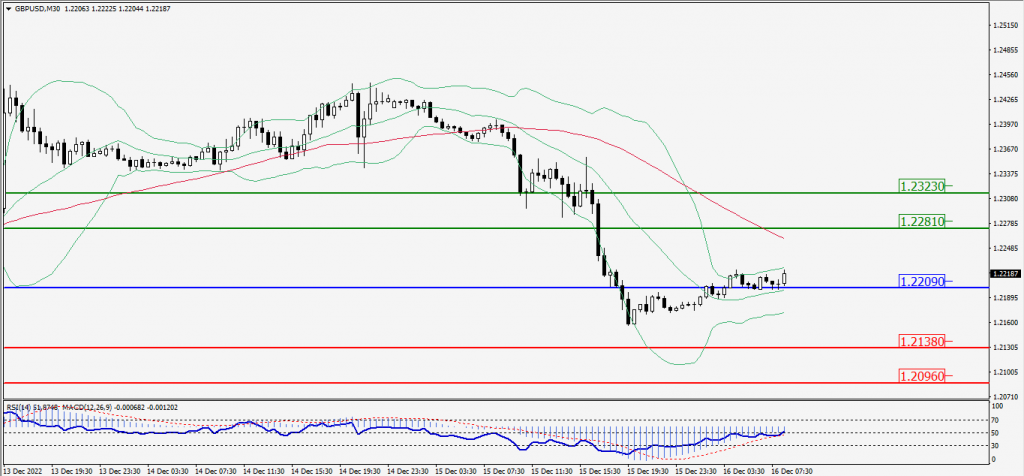
Green Lines Indicate Resistance Levels – Red Lines Indicate Support Levels
Light Blue is a Pivot Point – Black represents the price when the report was produced
USD/JPY Intraday: Trend on the downside
Our pivot point is at 137.490
Preferable Price Action: Sell position below pivot with the target at 136.620 and 136.030 in extension.
Alternative Price Action: The upside breakout of the pivot would call for 138.390 and 138.970.
Comment: MACD is negative territory and Pairs below 20MA.
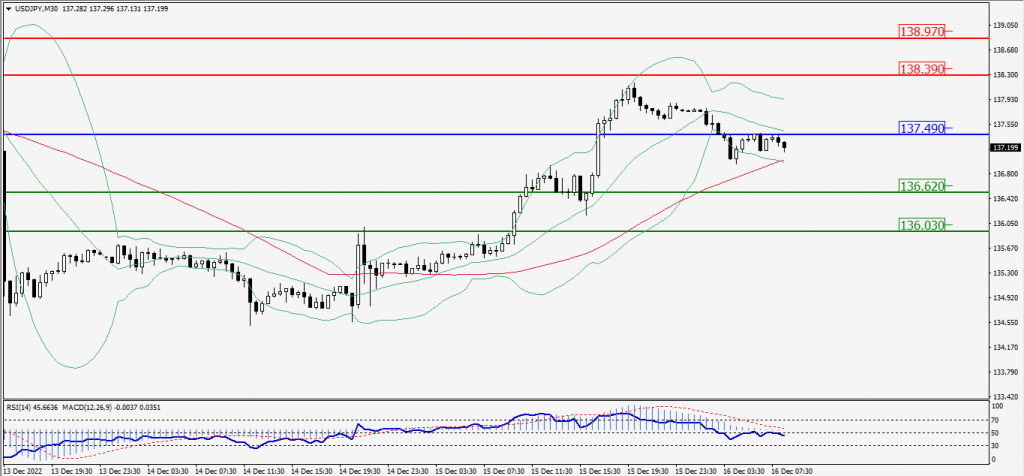
Green Lines Indicate Resistance Levels – Red Lines Indicate Support Levels
Light Blue is a Pivot Point – Black represents the price when the report was produced
AUD/USD Intraday: In a consolidation zone
Our pivot point is at 0.67290
Preferable Price Action: Sell Positions below pivot with targets at 0.66740 & 0.66440 in extension.
Alternative Price Action: Above pivot looks for a further upside with 0.67850 & 0.68170 as targets.
Comment: RSI is at 50 levels and Pairs below 55MA.
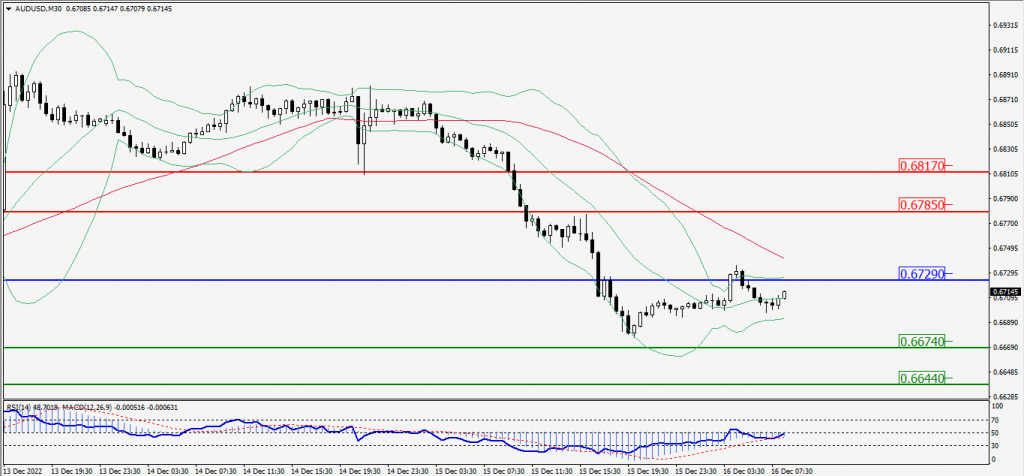
Green Lines Indicate Resistance Levels – Red Lines Indicate Support Levels
Light Blue is a Pivot Point – Black represents the price when the report was produced
CRUDEOIL Intraday: Trend on the downside
Our pivot point is at 76.26.
Preferable Price Action: Below pivots sell oil with 75.45 & 74.91 as targets.
Alternative Price Action: Buy crude up pivot with targets at 77.05 and 77.59 in extension.
Comment: MACD is negative territory and Pairs below 20MA & 55MA.
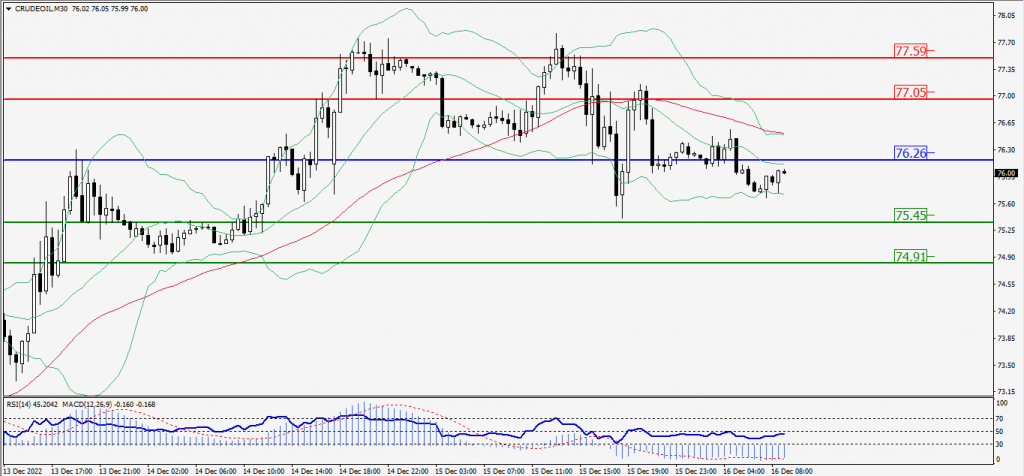
Green Lines Indicate Resistance Levels – Red Lines Indicate Support Levels
Light Blue is a Pivot Point – Black represents the price when the report was produced
XAU/USD Intraday: Major trend on the upside
Our pivot point is 1781.50
Preferable Price Action: Further upside to 1793.90 and 1802.20
Alternative Price Action: If the price gives a downside breakout of a pivot, then the price extends to 1769.60 and 1762.00.
Comment: MACD is positive territory and Pairs above 20MA & 55MA.
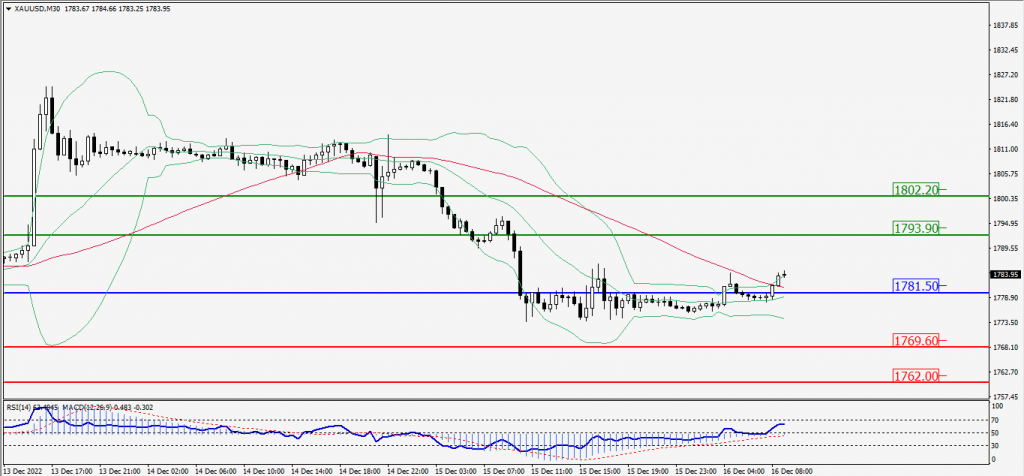
Green Lines Indicate Resistance Levels – Red Lines Indicate Support Levels
Light Blue is a Pivot Point – Black represents the price when the report was produced
Dow Jones Intraday: In a consolidation zone
Our pivot point is 33,404.00
Preferable Price Action: Take sell positions below the pivot with targets at 32,972.00 & 32,696.00.
Alternative Price Action: Above 33,404.00 looks for further upside to 33,835.00 & 34,117.00.
Comment: RSI is at 50 levels and Pairs below 55MA.
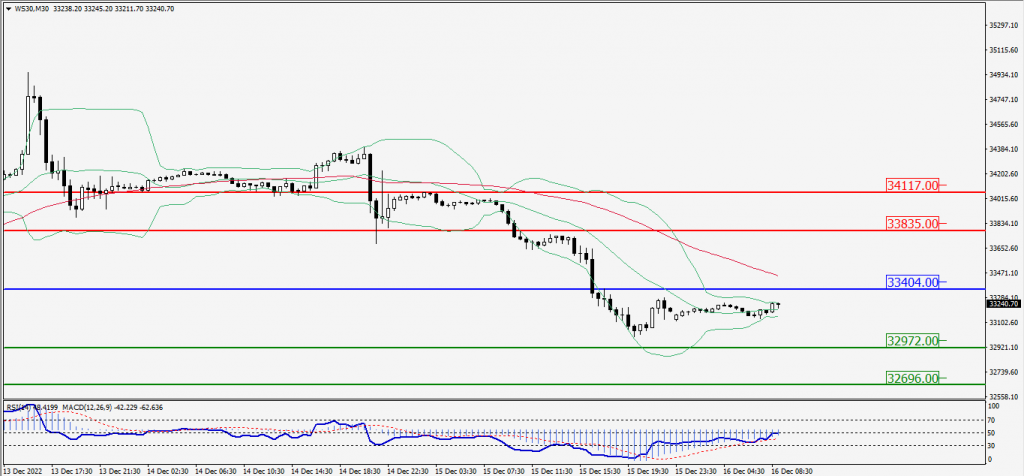
Green Lines Indicate Resistance Levels – Red Lines Indicate Support Levels
Light Blue is a Pivot Point – Black represents the price when the report was produced