Market Wrap: Stocks, Bonds, Commodities
US stocks closed lower for a fourth consecutive session on Thursday as economic data did little to alter expectations the Federal Reserve would continue raising interest rates for longer than previously thought.
The Dow Jones Industrial Average fell 146.51 points to 32,001.25, the S&P 500 lose 39.80 points to 3,719.89 and the Nasdaq Composite subtract 181.86 points to 10,342.94.
MSCI’s index of Asia-Pacific stocks outside Japan is ascend 2.50% to 547.44 levels. Australian index higher 0.50% to 6,892.50. Japanese Nikkei Index drop 1.68% to 27,199.74.
European stocks were positive on Friday, with the Stoxx Europe 50 Index rose 0.74% to 3,619.75, Germany’s DAX ascend 0.67% to 13,220.30, and France’s CAC up 0.89% to 6,299.09, and U.K.’s FTSE 100 surged 0.75% to 7,236.27.
Benchmark 10-year U.S. Treasury fell as demand for safe assets ascend again, today 10-year bond yields a positive 0.43% to 4.1420.
Oil prices turned higher on Friday as the dollar eased, but gains were capped by recession fears and fresh concerns that COVID outbreaks will dent fuel demand in China.
Spot Brent crude oil add 1.75% to $96.36 per barrel. US West Texas Intermediate crude is up 2.13% to $90.06 a barrel.
The yellow metal gold is advance 1.25% to 1,651.65 dollars per ounce.
Market Wrap: Forex
A top Federal Reserve Bank of New York official said on Friday that the bank sees promise in using a central bank digital dollar to speed up settlement time in foreign exchange markets.
Today, the U.S. dollar index measures the Greenback against a trade-weighted basket of six major currencies, which is fell 0.33% to 112.430.
The Euro US Dollar (EUR/USD) is a widely traded pair that is up 0.26% today. This left the pair trading around $0.97760.
The Japanese yen was positive against the U.S. dollar on Friday as the stock up. Today USD/JPY is drop 0.44% to 147.620 level.
Another commodity-related currency positive against the U.S dollar, AUD/USD surged 1.10% to 0.63560, and NZD/USD up 0.88 to 0.58220 level.
EUR/USD Intraday: Support level at 0.97590
Our pivot point is at 0.97590
Preferable Price Action: Take buy positions above pivot level with targets at 0.98310 & 0.98820 in extension.
Alternative Price Action: Below pivot looks for a further downside to 0.96940 & 0.96450.
Comment: RSI above 50 levels and Pairs above its 20MA & 55MA.
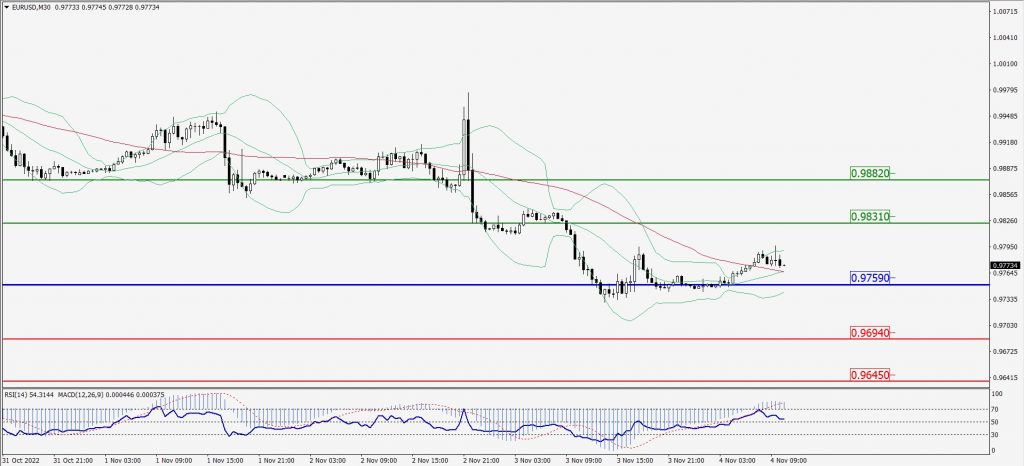
Green Lines Indicate Resistance Levels – Red Lines Indicate Support Levels
Light Blue is a Pivot Point – Black represents the price when the report was produced
GBP/USD Intraday: Trend on the upside
Our pivot point is at 1.12080
Preferable Price Action: Buy positions above pivot with targets at 1.12710 & 1.13300 in extension.
Alternative Price Action: The price below pivot would call for further downside to 1.11450 & 1.10860.
Comment: RSI above 50 levels and Pairs above 20MA.
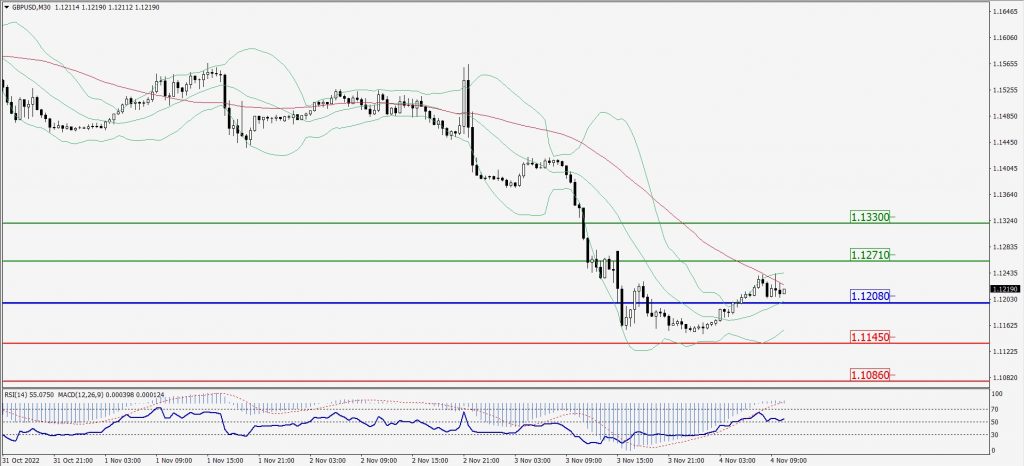
Green Lines Indicate Resistance Levels – Red Lines Indicate Support Levels
Light Blue is a Pivot Point – Black represents the price when the report was produced
USD/JPY Intraday: Resistance level at 148.300
Our pivot point is at 148.300
Preferable Price Action: Sell position below pivot with the target at 147.530 and 146.990 in extension.
Alternative Price Action: The upside breakout of the pivot would call for 148.980 and 149.460.
Comment: MACD is negative territory and Pairs below its 20MA & 55MA.
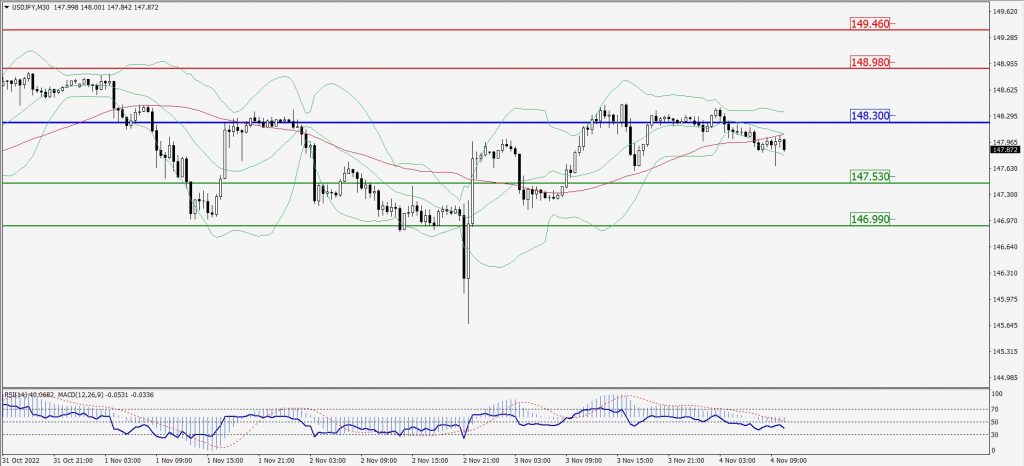
Green Lines Indicate Resistance Levels – Red Lines Indicate Support Levels
Light Blue is a Pivot Point – Black represents the price when the report was produced
AUD/USD Intraday: Major trend on the upside
Our pivot point is at 0.63350
Preferable Price Action: Buy Positions above pivot with targets at 0.63930 & 0.64300 in extension.
Alternative Price Action: Below pivot looks for a further downside with 0.62850 & 0.62430 as targets.
Comment: RSI above 50 levels and Pairs above its 20MA & 55MA.
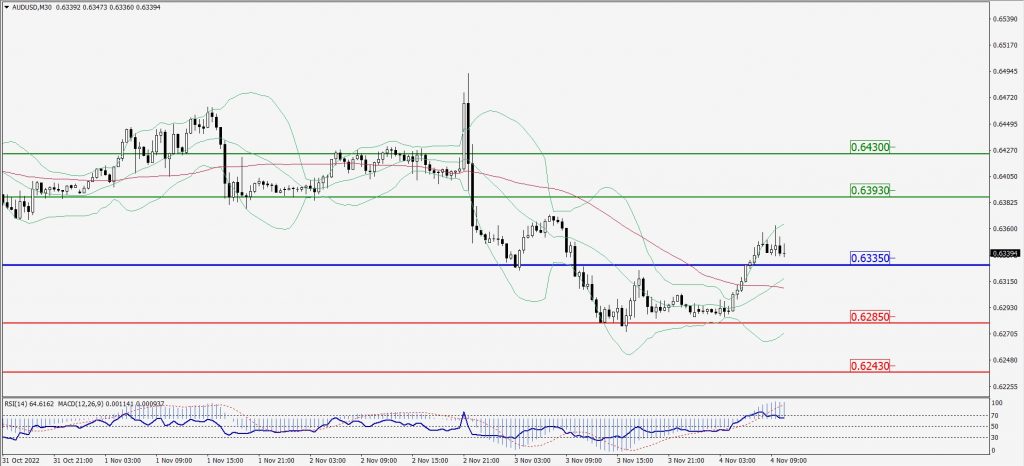
Green Lines Indicate Resistance Levels – Red Lines Indicate Support Levels
Light Blue is a Pivot Point – Black represents the price when the report was produced
CRUDEOIL Intraday: Trend on the upside
Our pivot point is at 89.17
Preferable Price Action: Above pivots buy oil with 90.71 & 91.77 as targets.
Alternative Price Action: Sell crude below pivot with targets at 87.93 and 87.00 in extension.
Comment: MACD is in the positive territory and Pairs above its 20MA & 55MA.
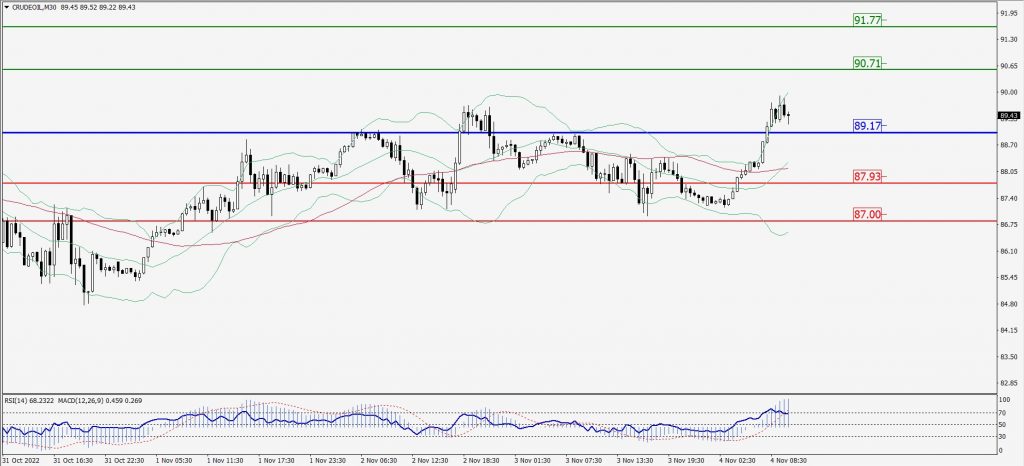
Green Lines Indicate Resistance Levels – Red Lines Indicate Support Levels
Light Blue is a Pivot Point – Black represents the price when the report was produced
XAU/USD Intraday: Major trend on the upside
Our pivot point is 1641.40
Preferable Price Action: Further upside to 1655.80 and 1666.60
Alternative Price Action: If the price gives a downside breakout of a pivot, then the price extends to 1628.60 and 1618.00.
Comment: MACD is positive territory and Pairs above its 20MA & 55MA.
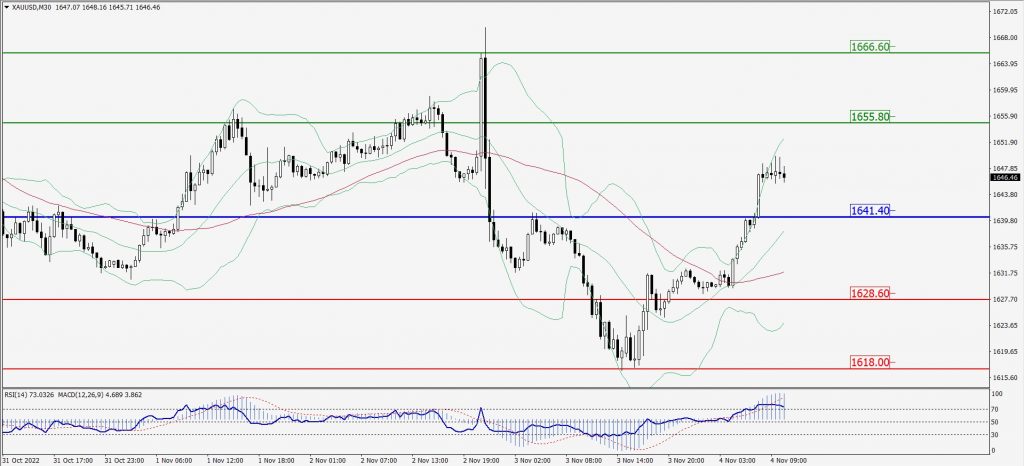
Green Lines Indicate Resistance Levels – Red Lines Indicate Support Levels
Light Blue is a Pivot Point – Black represents the price when the report was produced
Dow Jones Intraday: In a consolidation zone
Our pivot point is 31,974.00
Preferable Price Action: Take buy positions above pivot with targets at 32,302.00 & 32,568.00.
Alternative Price Action: Below 31,974.00 looks for further downside to 31,668.00 & 31,451.00.
Comment: RSI at 50 levels and Pairs above 20MA.
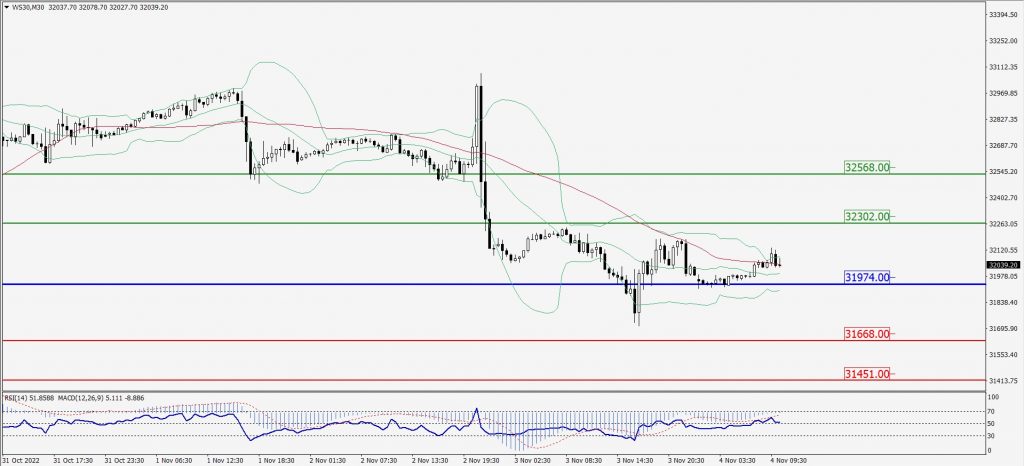
Green Lines Indicate Resistance Levels – Red Lines Indicate Support Levels
Light Blue is a Pivot Point – Black represents the price when the report was produced