Market Wrap: Stocks, Bonds, Commodities
US stocks ended the session lower and benchmark Treasury yields continued their ascent on Thursday after investors weighed generally upbeat earnings against the prospect that the Federal Reserve could hold firm on its aggressive policy for longer than they had hoped.
The Dow Jones Industrial Average fell 90.22 points to 30,333.59, the S&P 500 lose 29.38 points to 3,665.78 and the Nasdaq Composite subtract 65.66 points to 10,614.84.
MSCI’s index of Asia-Pacific stocks outside Japan is drop 0.59% to 536.36 levels. Australian index lower 0.80% to 6,676.80. Japanese Nikkei Index drop 0.43% to 26,890.58.
European stocks were negative on Friday, with the Stoxx Europe 50 Index fell 1.62% to 3,436.65, Germany’s DAX drop 1.60% to 12,570.65, and France’s CAC down 1.55% to 5,992.12, and U.K.’s FTSE 100 slipped 0.81% to 6,883.30.
Benchmark 10-year U.S. Treasury fell as demand for safe assets ascend again, today 10-year bond yields a positive 1.43% to 4.2860.
Oil slipped on Friday and was heading for a second weekly decline as investors weighed the impact of sharp interest rate rises on energy consumption, offsetting hopes of higher Chinese demand and output cuts by OPEC and its allies.
Spot Brent crude oil subtract 0.97% to $91.50 per barrel. US West Texas Intermediate crude is down 1.09% to $83.59 a barrel.
The yellow metal gold is decline 0.66% to 1,625.00 dollars per ounce.
Market Wrap: Forex
The U.S. dollar strengthened in early European trading Friday, as Treasury yields pushed to new highs, while sterling weakened as retail sales slumped in September while the U.K. political chaos continues.
Today, the U.S. dollar index measures the Greenback against a trade-weighted basket of six major currencies, which is rose 0.39% to 113.250.
The Euro US Dollar (EUR/USD) is a widely traded pair that is down 0.31% today. This left the pair trading around $0.97530.
The Japanese yen was positive against the U.S. dollar on Friday as the stock up. Today USD/JPY is ascend 0.52% to 150.890 level.
Another commodity-related currency negative against the U.S dollar, AUD/USD slipped 0.41% to 0.62490, and NZD/USD down 0.70 to 0.56400 level.
EUR/USD Intraday: Trend on the downside
Our pivot point is at 0.97910
Preferable Price Action: Take sell positions below pivot level with targets at 0.97430 & 0.97100 in extension.
Alternative Price Action: Above pivot looks for a further upside to 0.98370 & 0.98690.
Comment: RSI below 50 levels and Pairs below its 20MA & 55MA.
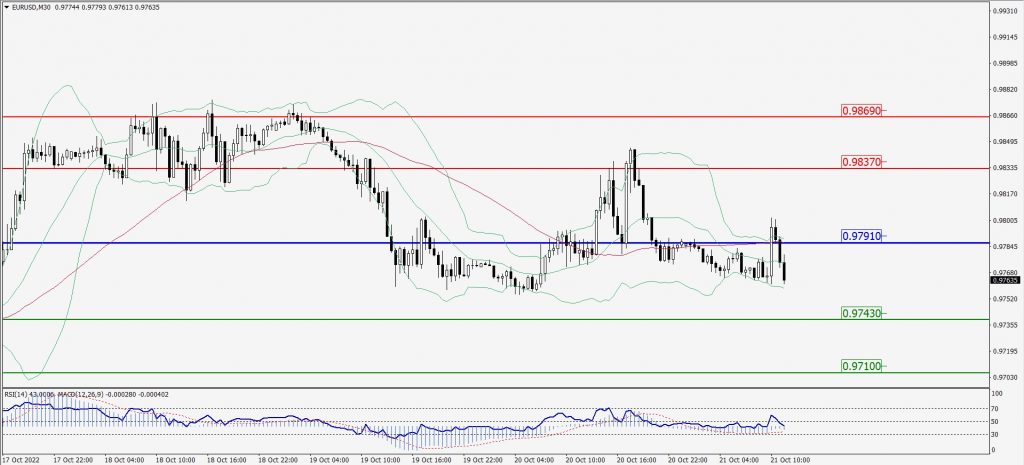
Green Lines Indicate Resistance Levels – Red Lines Indicate Support Levels
Light Blue is a Pivot Point – Black represents the price when the report was produced
GBP/USD Intraday: Trend on the downside
Our pivot point is at 1.11830
Preferable Price Action: Sell positions below pivot with targets at 1.10980 & 1.10340 in extension.
Alternative Price Action: The price above pivot would call for further upside to 1.12660 & 1.13370.
Comment: RSI below 50 levels and Pairs below its 20MA & 55MA.
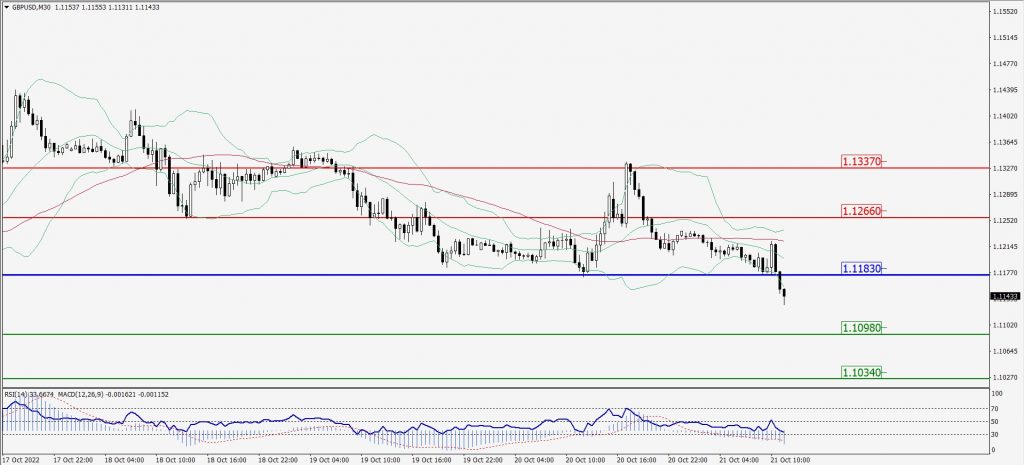
Green Lines Indicate Resistance Levels – Red Lines Indicate Support Levels
Light Blue is a Pivot Point – Black represents the price when the report was produced
USD/JPY Intraday: Major trend on the upside
Our pivot point is at 150.530
Preferable Price Action: Buy position above pivot with the target at 151.410 and 151.970 in extension.
Alternative Price Action: The downside breakout of the pivot would call for 149.800 and 149.220.
Comment: MACD is positive territory and Pairs above its 20MA & 55MA.
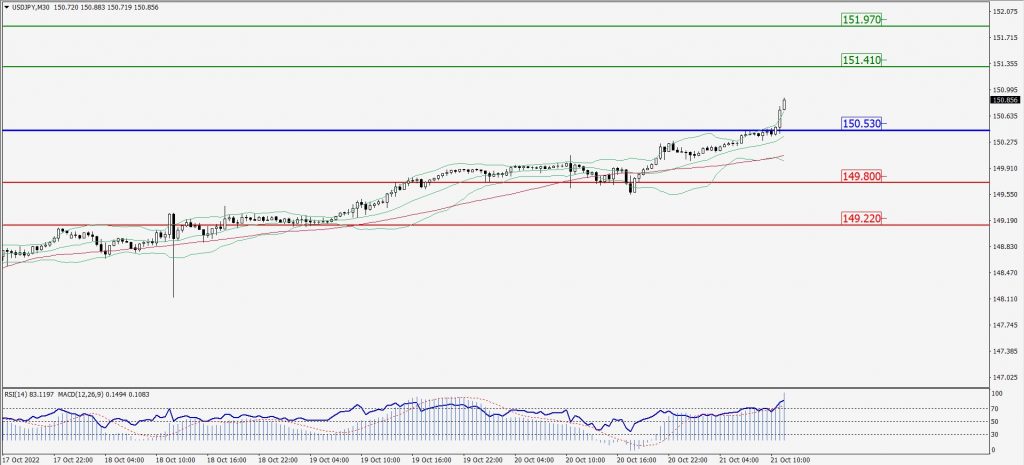
Green Lines Indicate Resistance Levels – Red Lines Indicate Support Levels
Light Blue is a Pivot Point – Black represents the price when the report was produced
AUD/USD Intraday: Support level at 0.62650
Our pivot point is at 0.62650
Preferable Price Action: Sell Positions below pivot with targets at 0.62250 & 0.61960 in extension.
Alternative Price Action: Above pivot looks for a further upside with 0.63030 & 0.63340 as targets.
Comment: RSI below 50 levels and Pairs below its 20MA & 55MA.
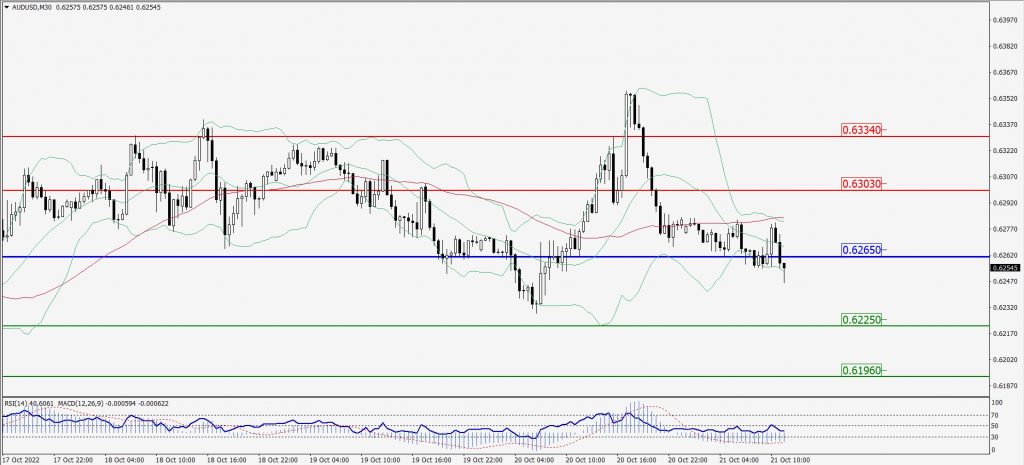
Green Lines Indicate Resistance Levels – Red Lines Indicate Support Levels
Light Blue is a Pivot Point – Black represents the price when the report was produced
CRUDEOIL Intraday: Trend on the downside
Our pivot point is at 83.80
Preferable Price Action: Below pivots sell oil with 82.40 & 81.38 as targets.
Alternative Price Action: Buy crude above pivot with targets at 85.05 and 85.98 in extension.
Comment: MACD is in the negative territory and Pairs below its 20MA & 55MA.
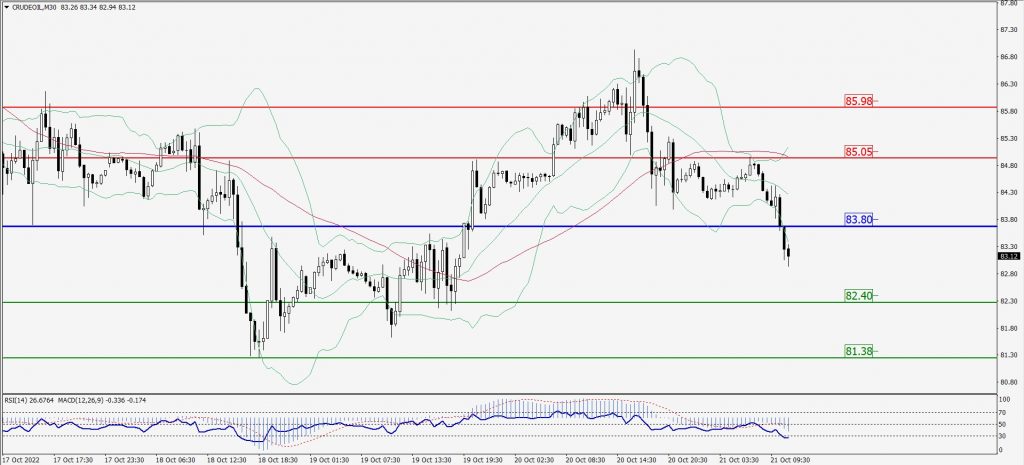
Green Lines Indicate Resistance Levels – Red Lines Indicate Support Levels
Light Blue is a Pivot Point – Black represents the price when the report was produced
XAU/USD Intraday: Resistance level at 1627.30
Our pivot point is 1627.30
Preferable Price Action: Further downside to 1614.20 and 1605.50
Alternative Price Action: If the price gives an upside breakout of a pivot, then the price extends to 1638.00 and 1648.70.
Comment: MACD is negative territory and Pairs below its 20MA & 55MA.
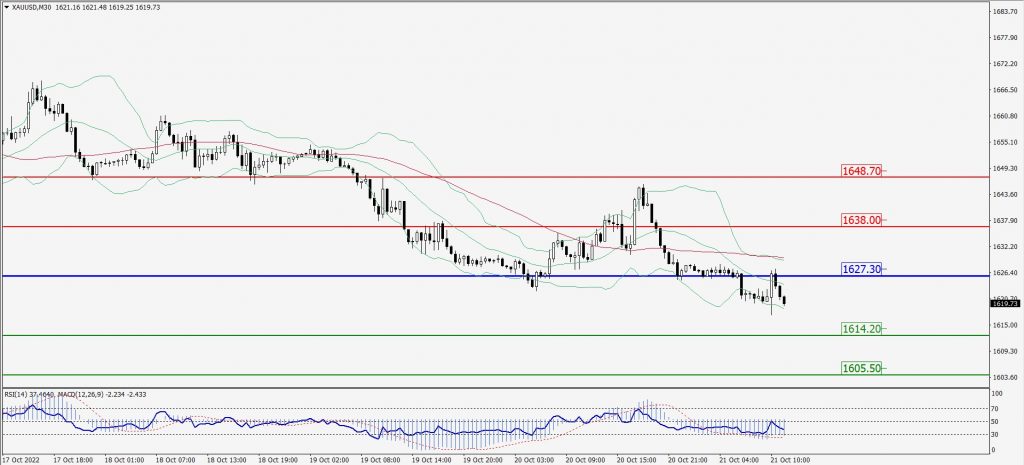
Green Lines Indicate Resistance Levels – Red Lines Indicate Support Levels
Light Blue is a Pivot Point – Black represents the price when the report was produced
Dow Jones Intraday: Support level at 30,289.00
Our pivot point is 30,289.00
Preferable Price Action: Take sell positions below pivot with targets at 30,015.00 & 29,815.00.
Alternative Price Action: Above 30,289.00 looks for further upside to 30,567.00 & 30,767.00.
Comment: RSI below 50 levels and Pairs below its 20MA & 55MA.
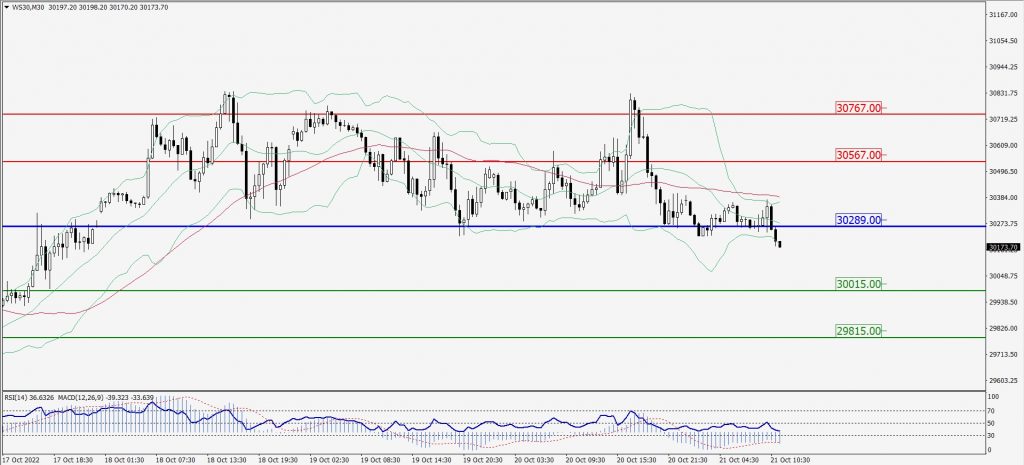
Green Lines Indicate Resistance Levels – Red Lines Indicate Support Levels
Light Blue is a Pivot Point – Black represents the price when the report was produced