Market Wrap: Stocks, Bonds, Commodities
Wall Street stocks closed higher and Treasury yields dipped on Tuesday as upbeat earnings and better-than-expected factory data stoked a risk-on rally.
The Dow Jones Industrial Average rose 337.98 points to 30,523.80, the S&P 500 gain 42.03 points to 3,719.98 and the Nasdaq Composite add 96.60 points to 10,772.40.
MSCI’s index of Asia-Pacific stocks outside Japan is drop 1.25% to 545.55 levels. Australian index higher 0.31% to 6,800.10. Japanese Nikkei Index ascend 0.37% to 27,257.38.
European stocks were mixed on Wednesday, with the Stoxx Europe 50 Index rose 0.20% to 3,470.65, Germany’s DAX drop 0.30% to 12,729.92, and France’s CAC down 0.06% to 6,063.48, and U.K.’s FTSE 100 slipped 0.51% to 6,905.94.
Benchmark 10-year U.S. Treasury fell as demand for safe assets ascend again, today 10-year bond yields a positive 1.88% to 4.0730.
Oil prices climbed on Wednesday, paring losses from the previous session, as investors jumped into riskier assets such as commodities amid gains in broader equity markets and on signs of renewed demand from top oil importer China.
Spot Brent crude oil subtract 0.13% to $89.89 per barrel. US West Texas Intermediate crude is up 0.02% to $82.09 a barrel.
The yellow metal gold is decline 0.57% to 1,646.30 dollars per ounce.
Market Wrap: Forex
The US dollar edged higher against a basket of currencies on Tuesday, shaking off some of the weaknesses of the previous session, but a revival in risk appetite in global financial markets kept a lid on its gains.
Today, the U.S. dollar index measures the Greenback against a trade-weighted basket of six major currencies, which is rose 0.28% to 112.320.
The Euro US Dollar (EUR/USD) is a widely traded pair that is down 0.33% today. This left the pair trading around $0.98190.
The Japanese yen was positive against the U.S. dollar on Wednesday as the stock up. Today USD/JPY is ascend 0.10% to 149.390 level.
Another commodity-related currency negative against the U.S dollar, AUD/USD slipped 0.21% to 0.62970, and NZD/USD down 0.02 to 0.56830 level.
EUR/USD Intraday: Trend on the downside
Our pivot point is at 0.98480
Preferable Price Action: Take sell positions below pivot level with targets at 0.97970 & 0.97550 in extension.
Alternative Price Action: Above pivot looks for a further upside to 0.98970 & 0.99320.
Comment: RSI below 50 levels and Pairs below its 20MA & 55MA.
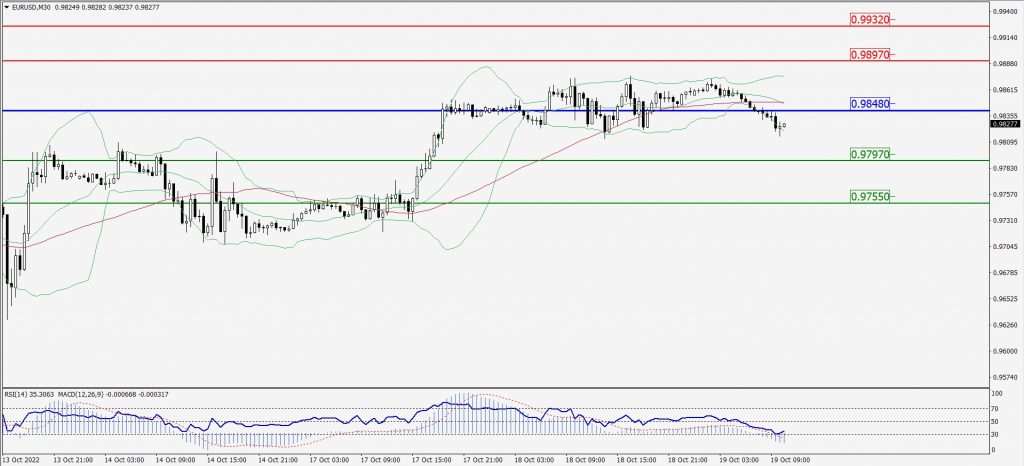
Green Lines Indicate Resistance Levels – Red Lines Indicate Support Levels
Light Blue is a Pivot Point – Black represents the price when the report was produced
GBP/USD Intraday: Trend on the downside
Our pivot point is at 1.13200
Preferable Price Action: Sell positions below pivot with targets at 1.12040 & 1.11260 in extension.
Alternative Price Action: The price above pivot would call for further upside to 1.14180 & 1.15090.
Comment: RSI below 50 levels and Pairs below its 20MA & 55MA.
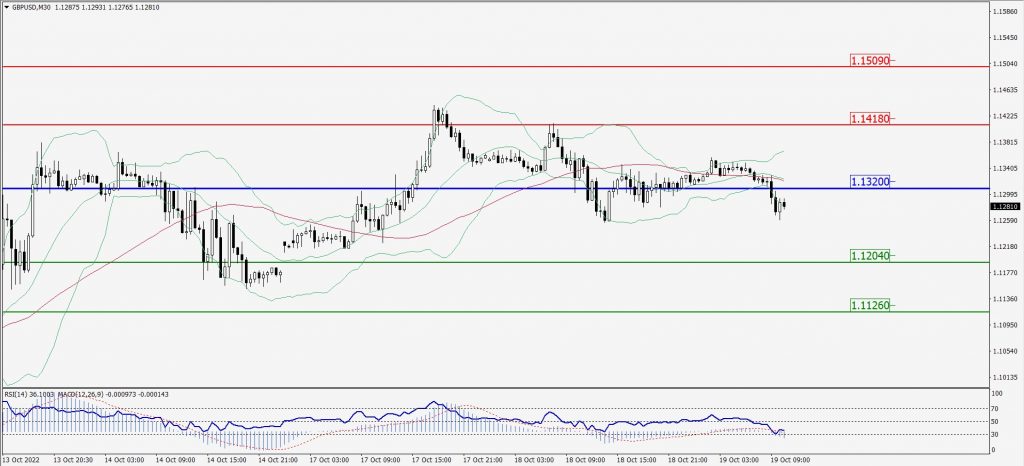
Green Lines Indicate Resistance Levels – Red Lines Indicate Support Levels
Light Blue is a Pivot Point – Black represents the price when the report was produced
USD/JPY Intraday: Support level at 149.260
Our pivot point is at 149.260
Preferable Price Action: Buy position above pivot with the target at 150.170 and 150.850 in extension.
Alternative Price Action: The downside breakout of the pivot would call for 148.380 and 147.720.
Comment: MACD is positive territory and Pairs above its 20MA & 55MA.
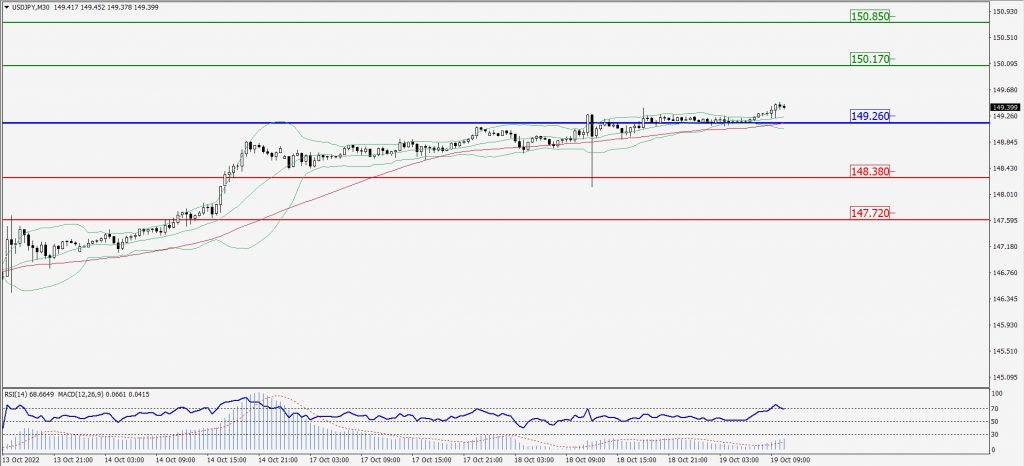
Green Lines Indicate Resistance Levels – Red Lines Indicate Support Levels
Light Blue is a Pivot Point – Black represents the price when the report was produced
AUD/USD Intraday: Resistance level at 0.63220
Our pivot point is at 0.63220
Preferable Price Action: Sell Positions below pivot with targets at 0.62660 & 0.62290 in extension.
Alternative Price Action: Above pivot looks for a further upside with 0.63760 & 0.64160 as targets.
Comment: RSI below 50 levels and Pairs below its 20MA & 55MA.
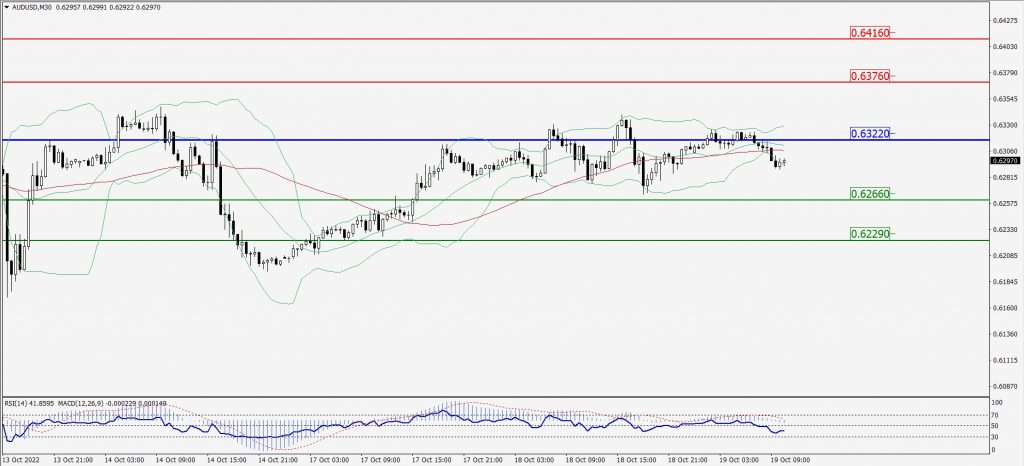
Green Lines Indicate Resistance Levels – Red Lines Indicate Support Levels
Light Blue is a Pivot Point – Black represents the price when the report was produced
CRUDEOIL Intraday: Trend on the downside
Our pivot point is at 83.48
Preferable Price Action: Below pivots sell oil with 81.39 & 79.93 as targets.
Alternative Price Action: Buy crude above pivot with targets at 85.46 and 86.97 in extension.
Comment: MACD is in the negative territory and Pairs below 55MA.
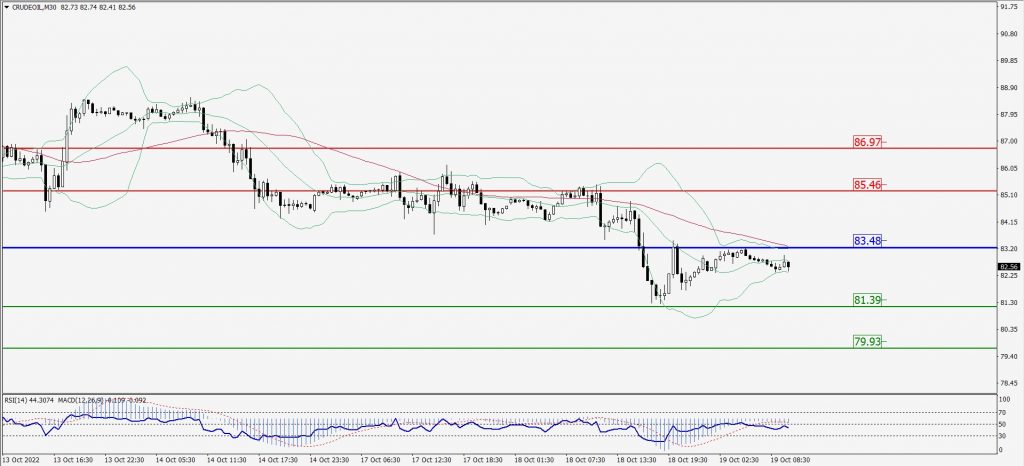
Green Lines Indicate Resistance Levels – Red Lines Indicate Support Levels
Light Blue is a Pivot Point – Black represents the price when the report was produced
XAU/USD Intraday: In a consolidation zone
Our pivot point is 1649.20
Preferable Price Action: Further downside to 1636.20 and 1626.60
Alternative Price Action: If the price gives an upside breakout of a pivot, then the price extends to 1660.40 and 1670.20.
Comment: MACD is negative territory and Pairs below its 20MA & 55MA.
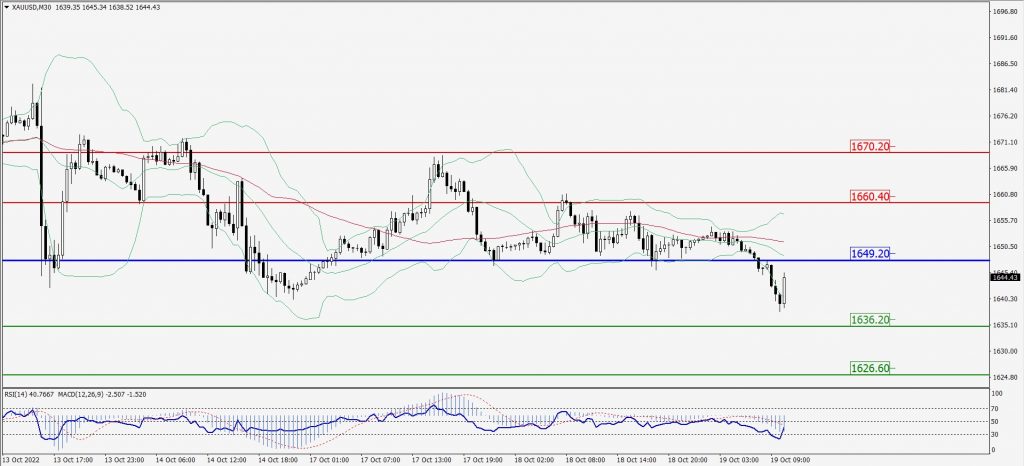
Green Lines Indicate Resistance Levels – Red Lines Indicate Support Levels
Light Blue is a Pivot Point – Black represents the price when the report was produced
Dow Jones Intraday: Trend on the downside
Our pivot point is 30,825.00
Preferable Price Action: Take sell positions below pivot with targets at 30,278.00 & 29,903.00.
Alternative Price Action: Above 30,825.00 looks for further upside to 31,299.00 & 31,645.00.
Comment: RSI below 50 levels and Pairs below its 20MA & 55MA.
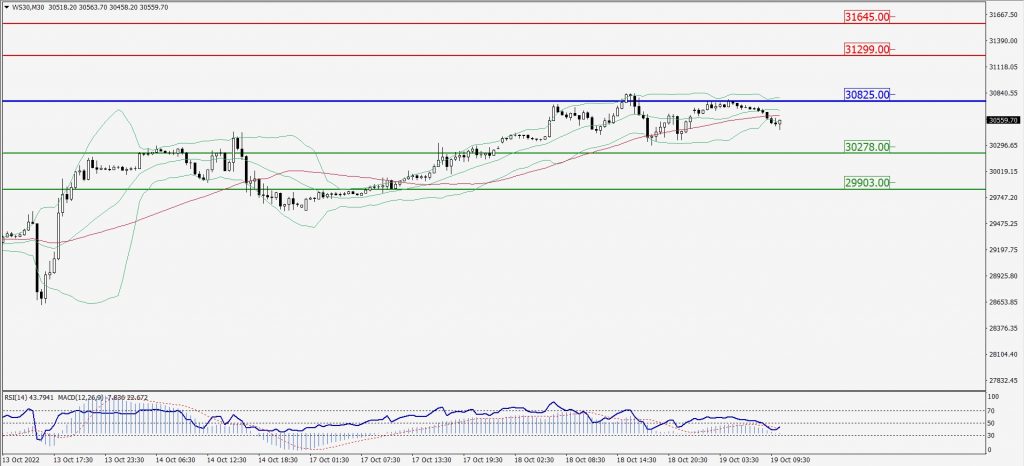
Green Lines Indicate Resistance Levels – Red Lines Indicate Support Levels
Light Blue is a Pivot Point – Black represents the price when the report was produced