Market Wrap: Stocks, Bonds, Commodities
US stocks ended a choppy session slightly lower on Wednesday after minutes from the last Federal Reserve meeting showed policymakers agreed they needed to maintain a more restrictive policy stance.
The Dow Jones Industrial Average fell 28.34 points to 29,210.85, the S&P 500 lose 11.81 points to 3,577.03 and the Nasdaq Composite subtract 9.09 points to 10,417.10.
MSCI’s index of Asia-Pacific stocks outside Japan is drop 1.24% to 539.66 levels. Australian index lower 0.07% to 6,642.60. Japanese Nikkei Index drop 0.60% to 26,237.42.
European stocks were mixed on Thursday, with the Stoxx Europe 50 Index fell 0.28% to 3,322.05, Germany’s DAX ascend 0.21% to 12,198.15, and France’s CAC down 0.33% to 5,800.39, and U.K.’s FTSE 100 slipped 0.48% to 6,787.57.
Benchmark 10-year U.S. Treasury fell as demand for safe assets ascend again, today 10-year bond yields a positive 0.75% to 3.9310.
Oil prices struggled to find their footing in early Asian trade on Thursday after a weakening global demand outlook depressed the market in the last session.
Spot Brent crude oil add 0.62% to $92.99 per barrel. US West Texas Intermediate crude is up 0.46% to $87.66 a barrel.
The yellow metal gold is advance 0.02% to 1,677.65 dollars per ounce.
Market Wrap: Forex
The U.S. dollar traded in a tight range in early European trading Thursday ahead of the release of widely-watched U.S. inflation data, while sterling edged lower ahead of the potential end of the Bank of England’s emergency bond-buying program.
Today, the U.S. dollar index measures the Greenback against a trade-weighted basket of six major currencies, which is rose 0.02% to 113.270.
The Euro US Dollar (EUR/USD) is a widely traded pair that is down 0.02% today. This left the pair trading around $0.97030.
The Japanese yen was positive against the U.S. dollar on Thursday as the stock up. Today USD/JPY is drop 0.04% to 146.840 level.
Another commodity-related currency negative against the U.S dollar, AUD/USD slipped 0.05% to 0.62730, and NZD/USD subtract 0.03 to 0.56070 level.
EUR/USD Intraday: Resistance level at 0.97090
Our pivot point is at 0.97090
Preferable Price Action: Take sell positions below pivot level with targets at 0.96630 & 0.96310 in extension.
Alternative Price Action: Above pivot looks for a further upside to 0.97440 & 0.97730.
Comment: RSI below 50 levels and Pairs below its 20MA & 55MA.
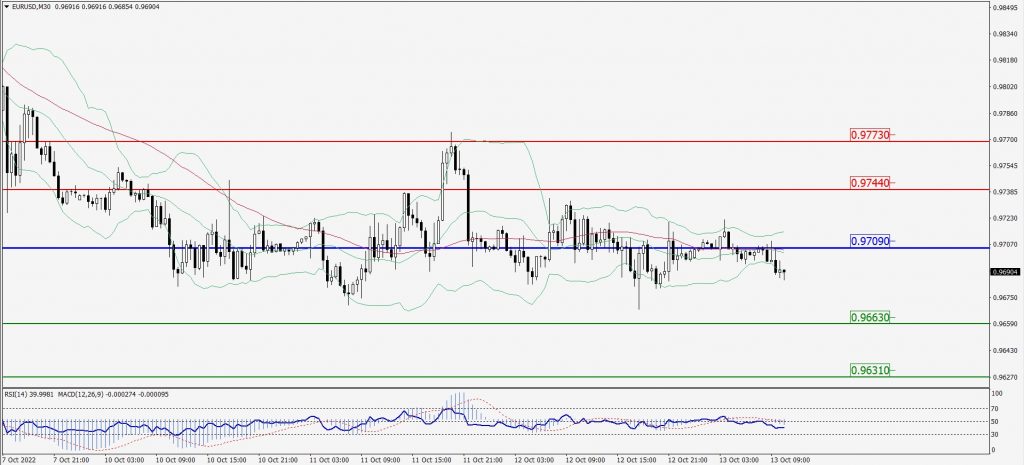
Green Lines Indicate Resistance Levels – Red Lines Indicate Support Levels
Light Blue is a Pivot Point – Black represents the price when the report was produced
GBP/USD Intraday: Trend on the downside
Our pivot point is at 1.11240
Preferable Price Action: Sell positions below pivot with targets at 1.10090 & 1.09290 in extension.
Alternative Price Action: The price above pivot would call for further upside to 1.12460 & 1.13330.
Comment: RSI below 50 levels and Pairs below 20MA.
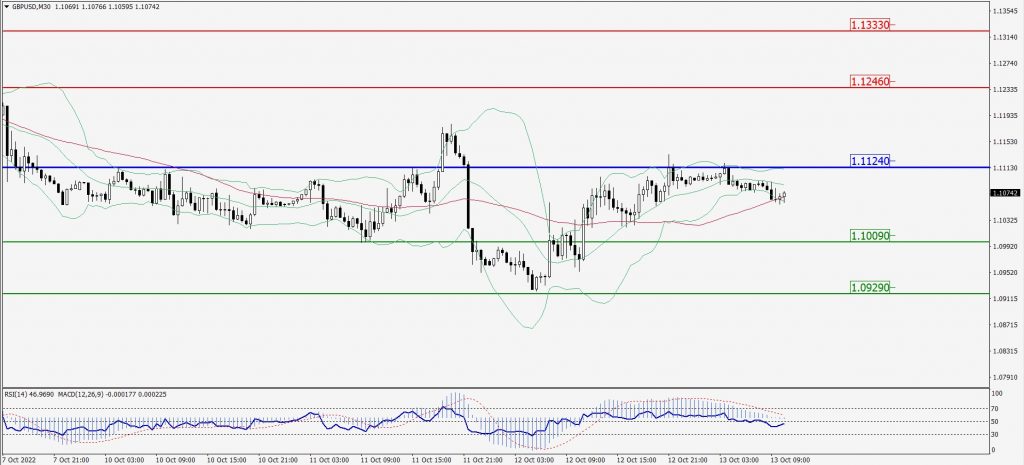
Green Lines Indicate Resistance Levels – Red Lines Indicate Support Levels
Light Blue is a Pivot Point – Black represents the price when the report was produced
USD/JPY Intraday: In a consolidation zone
Our pivot point is at 146.760
Preferable Price Action: Buy position above pivot with the target at 147.260 and 147.670 in extension.
Alternative Price Action: The downside breakout of the pivot would call for 146.280 and 145.930.
Comment: MACD is flat territory and Pairs above 55MA.
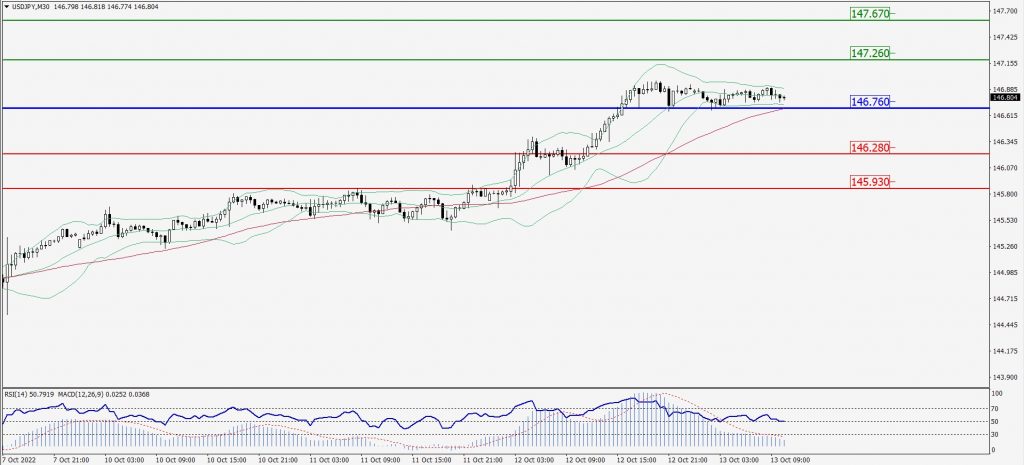
Green Lines Indicate Resistance Levels – Red Lines Indicate Support Levels
Light Blue is a Pivot Point – Black represents the price when the report was produced
AUD/USD Intraday: In a consolidation zone
Our pivot point is at 0.63080
Preferable Price Action: Sell Positions below pivot with targets at 0.62310 & 0.61780 in extension.
Alternative Price Action: Above pivot looks for a further upside with 0.63690 & 0.64220 as targets.
Comment: RSI at 50 levels.
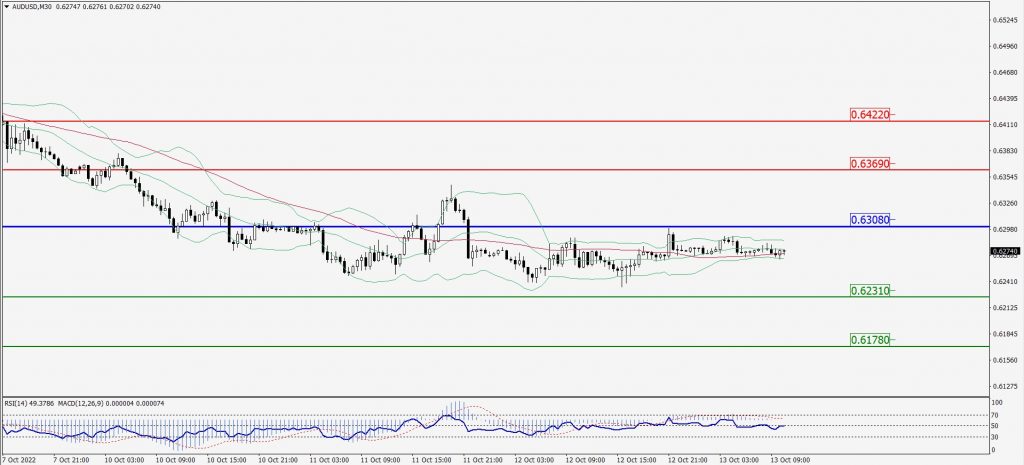
Green Lines Indicate Resistance Levels – Red Lines Indicate Support Levels
Light Blue is a Pivot Point – Black represents the price when the report was produced
CRUDEOIL Intraday: Support level at 86.02
Our pivot point is at 86.02
Preferable Price Action: Above pivots buy oil with 87.77 & 89.06 as targets.
Alternative Price Action: Sell crude below pivot with targets at 84.52 and 83.25 in extension.
Comment: MACD is in the positive territory and Pairs above 20MA.
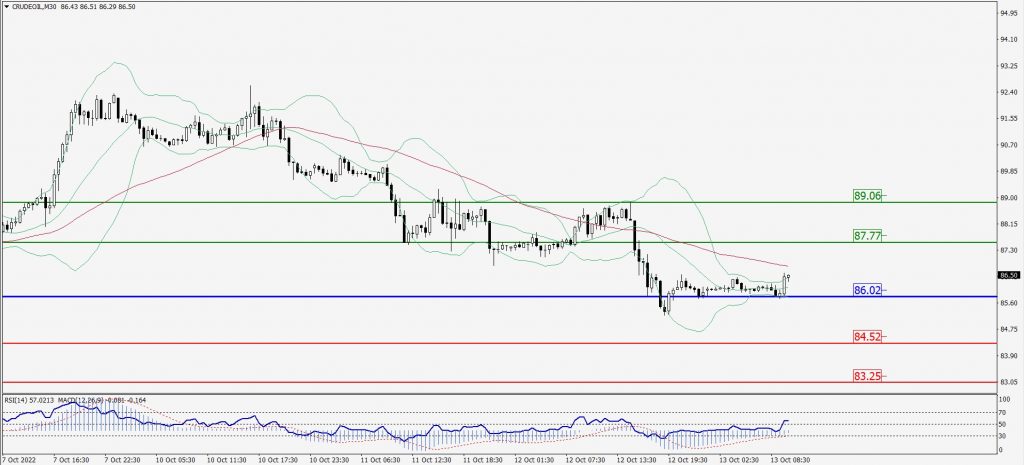
Green Lines Indicate Resistance Levels – Red Lines Indicate Support Levels
Light Blue is a Pivot Point – Black represents the price when the report was produced
XAU/USD Intraday: Trend on the downside
Our pivot point is 1676.80
Preferable Price Action: Further downside to 1658.50 and 1644.20
Alternative Price Action: If the price gives an upside breakout of a pivot, then the price extends to 1693.60 and 1706.60.
Comment: MACD is negative territory and Pairs below 20MA.
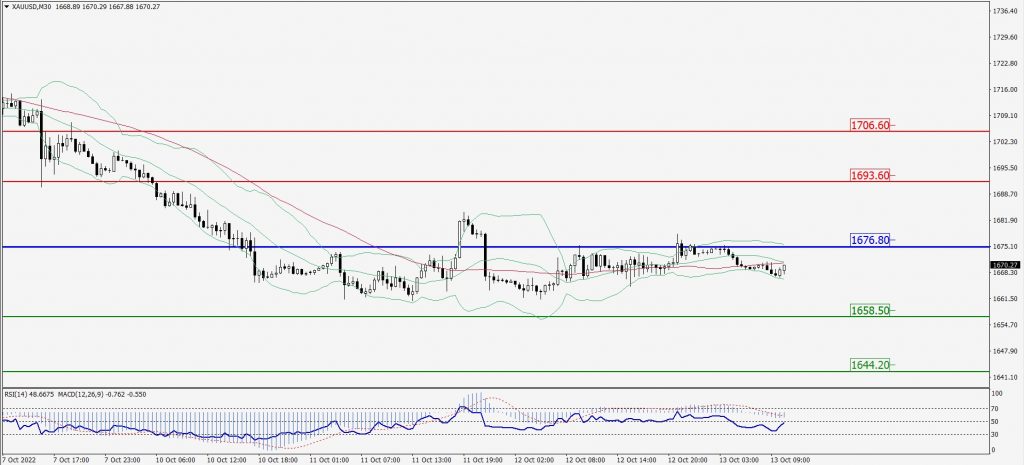
Green Lines Indicate Resistance Levels – Red Lines Indicate Support Levels
Light Blue is a Pivot Point – Black represents the price when the report was produced
Dow Jones Intraday: Major support level at 29,247.00
Our pivot point is 29,247.00
Preferable Price Action: Take buy positions above pivot with targets at 29,635.00 & 29,912.00.
Alternative Price Action: Below 29,247.00 looks for further downside to 28,904.00 & 28,648.00.
Comment: RSI above 50 levels and Pairs above 20MA.
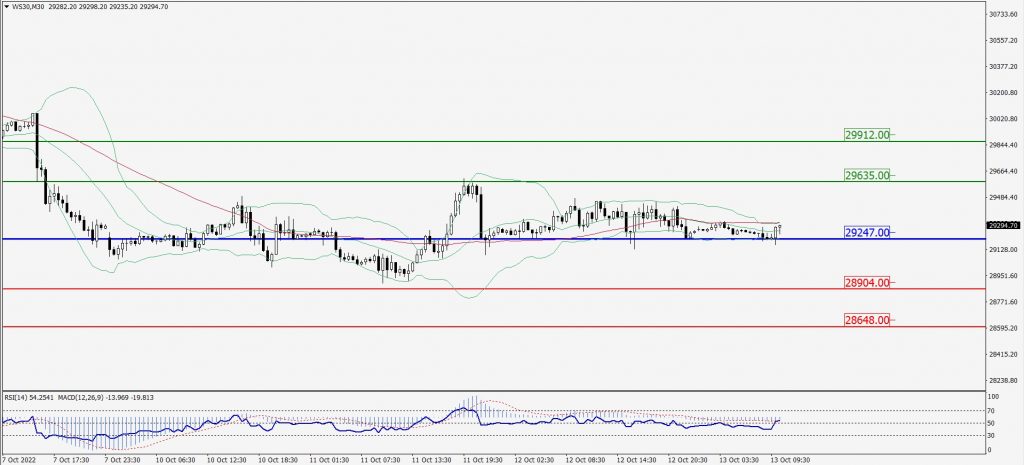
Green Lines Indicate Resistance Levels – Red Lines Indicate Support Levels
Light Blue is a Pivot Point – Black represents the price when the report was produced