Market Wrap: Stocks, Bonds, Commodities
The S&P 500 and Nasdaq ended lower on Tuesday, with indications from the Bank of England that it would support the country’s bond market for just three more days adding to market jitters late in the session.
The Dow Jones Industrial Average rose 36.31 points to 29,239.19, the S&P 500 lose 23.55 points to 3,588.84 and the Nasdaq Composite subtract 115.91 points to 10,426.19.
MSCI’s index of Asia-Pacific stocks outside Japan is ascend 0.12% to 545.93 levels. Australian index higher 0.04% to 6,647.00. Japanese Nikkei Index drop 0.02% to 26,396.83.
European stocks were negative on Wednesday, with the Stoxx Europe 50 Index fell 0.24% to 3,332.25, Germany’s DAX drop 0.36% to 12,178.75, and France’s CAC down 0.26% to 5,818.90, and U.K.’s FTSE 100 slipped 0.01% to 6,885.20.
Benchmark 10-year U.S. Treasury fell as demand for safe assets ascend again, today 10-year bond yields a negative 0.15% to 3.9330.
Oil prices fell for a third straight session on Wednesday as investors fretted about a hit to fuel demand from growing risks of a global recession and tightening COVID-19 curbs in China.
Spot Brent crude oil add 0.37% to $94.59 per barrel. US West Texas Intermediate crude is up 0.16% to $89.47 a barrel.
The yellow metal gold is decline 0.50% to 1,677.70 dollars per ounce.
Market Wrap: Forex
The dollar scaled new 24-year heights on the yen on Wednesday, breaching levels that prompted intervention by Japanese officials last month, while investors in sterling were scratching their heads about the Bank of England’s plans.
Today, the U.S. dollar index measures the Greenback against a trade-weighted basket of six major currencies, which is fell 0.04% to 113.080.
The Euro US Dollar (EUR/USD) is a widely traded pair that is up 0.12% today. This left the pair trading around $0.97150.
The Japanese yen was positive against the U.S. dollar on Wednesday as the stock up. Today USD/JPY is ascend 0.28% to 146.250 level.
Another commodity-related currency mixed against the U.S dollar, AUD/USD slipped 0.10% to 0.62630, and NZD/USD add 0.29 to 0.56000 level.
EUR/USD Intraday: In a consolidation zone
Our pivot point is at 0.96920
Preferable Price Action: Take buy positions above pivot level with targets at 0.97670 & 0.98190 in extension.
Alternative Price Action: Below pivot looks for a further downside to 0.96320 & 0.95810.
Comment: RSI at 50 levels.
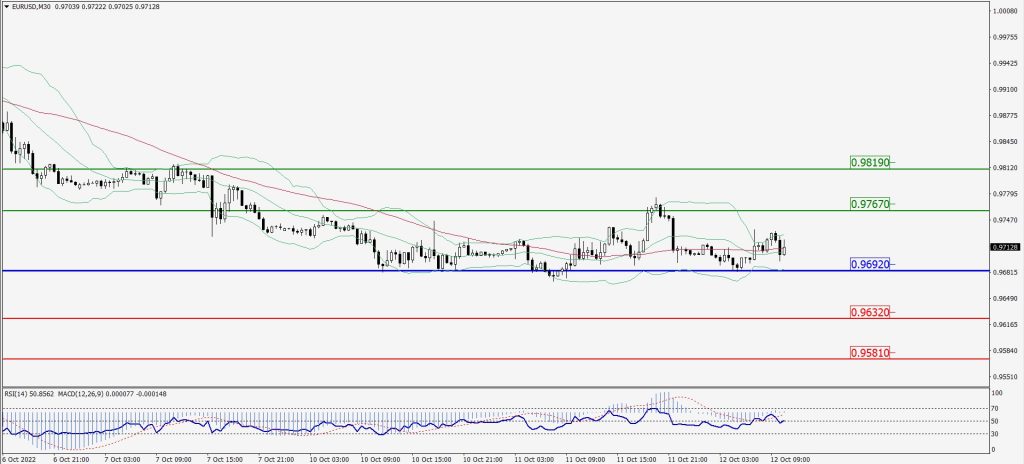
Green Lines Indicate Resistance Levels – Red Lines Indicate Support Levels
Light Blue is a Pivot Point – Black represents the price when the report was produced
GBP/USD Intraday: Trend on the downside
Our pivot point is at 1.10220
Preferable Price Action: Sell positions below pivot with targets at 1.09080 & 1.08330 in extension.
Alternative Price Action: The price above pivot would call for further upside to 1.11160 & 1.11980.
Comment: RSI below 50 levels and Pairs below 55MA.
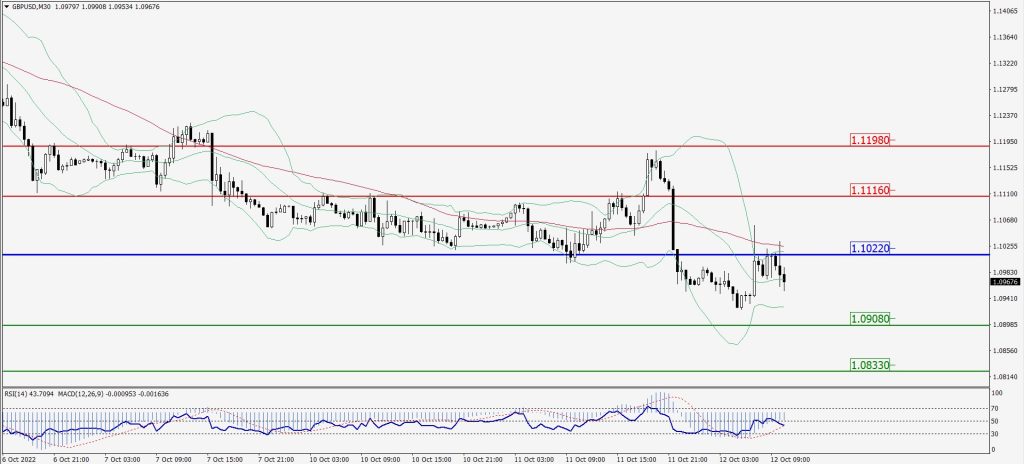
Green Lines Indicate Resistance Levels – Red Lines Indicate Support Levels
Light Blue is a Pivot Point – Black represents the price when the report was produced
USD/JPY Intraday: Trend on the upside
Our pivot point is at 146.000
Preferable Price Action: Buy position above pivot with the target at 146.430 and 146.760 in extension.
Alternative Price Action: The downside breakout of the pivot would call for 145.630 and 145.340.
Comment: MACD is positive territory and Pairs above its 55MA & 20MA.
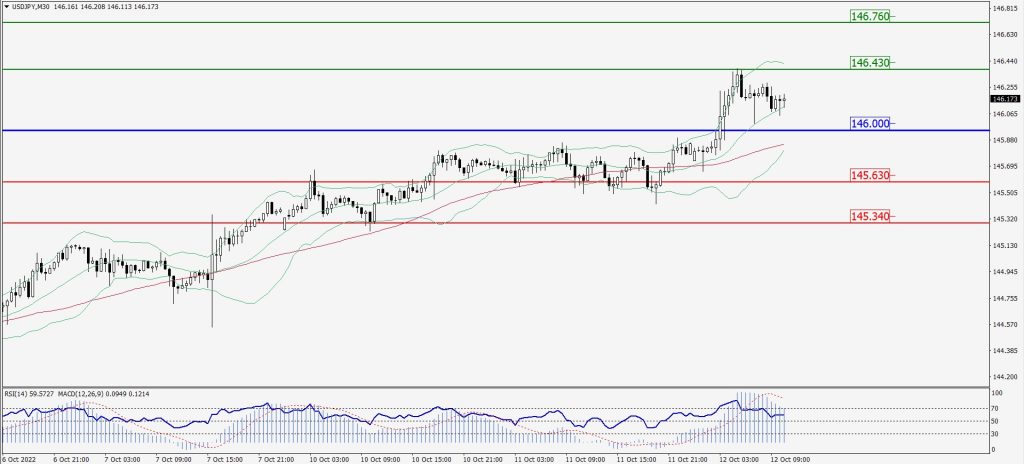
Green Lines Indicate Resistance Levels – Red Lines Indicate Support Levels
Light Blue is a Pivot Point – Black represents the price when the report was produced
AUD/USD Intraday: Trend on the downside
Our pivot point is at 0.63080
Preferable Price Action: Sell Positions below pivot with targets at 0.62310 & 0.61780 in extension.
Alternative Price Action: Above pivot looks for a further upside with 0.63690 & 0.64220 as targets.
Comment: RSI below 50 levels and Pairs below 55MA.
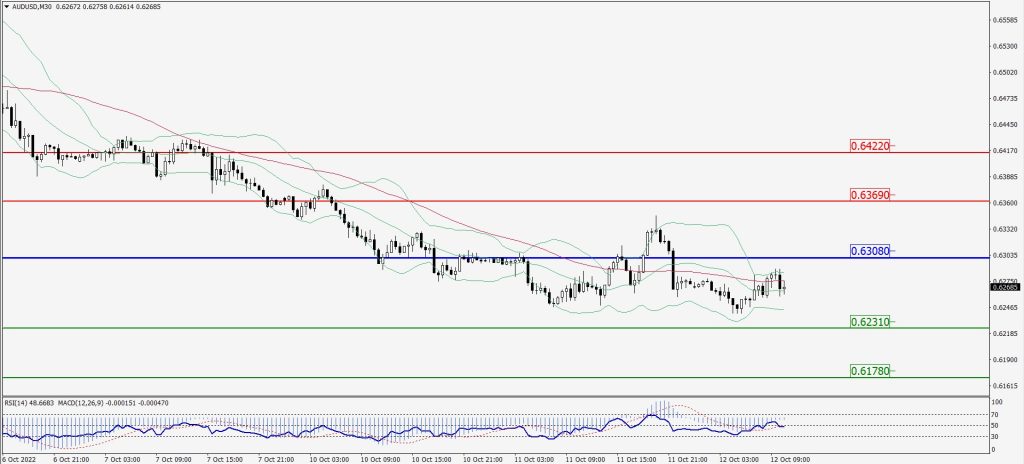
Green Lines Indicate Resistance Levels – Red Lines Indicate Support Levels
Light Blue is a Pivot Point – Black represents the price when the report was produced
CRUDEOIL Intraday: Support level at 87.63
Our pivot point is at 87.63
Preferable Price Action: Above pivots buy oil with 89.32 & 90.49 as targets.
Alternative Price Action: Sell crude below pivot with targets at 86.31 and 85.02 in extension.
Comment: MACD is in the positive territory and Pairs above 20MA.
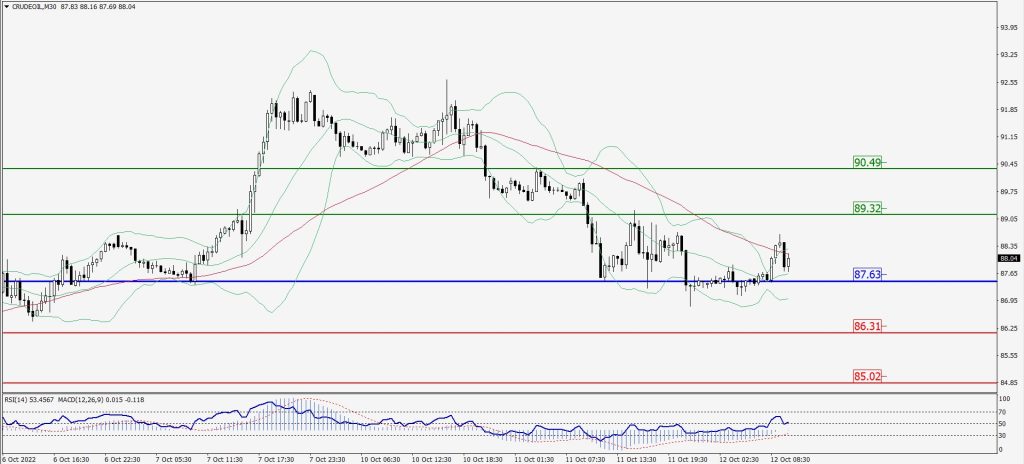
Green Lines Indicate Resistance Levels – Red Lines Indicate Support Levels
Light Blue is a Pivot Point – Black represents the price when the report was produced
XAU/USD Intraday: Trend on the upside
Our pivot point is 1663.10
Preferable Price Action: Further upside to 1683.40 and 1700.70
Alternative Price Action: If the price gives a downside breakout of a pivot, then the price extends to 1645.60 and 1631.90.
Comment: MACD is positive territory.
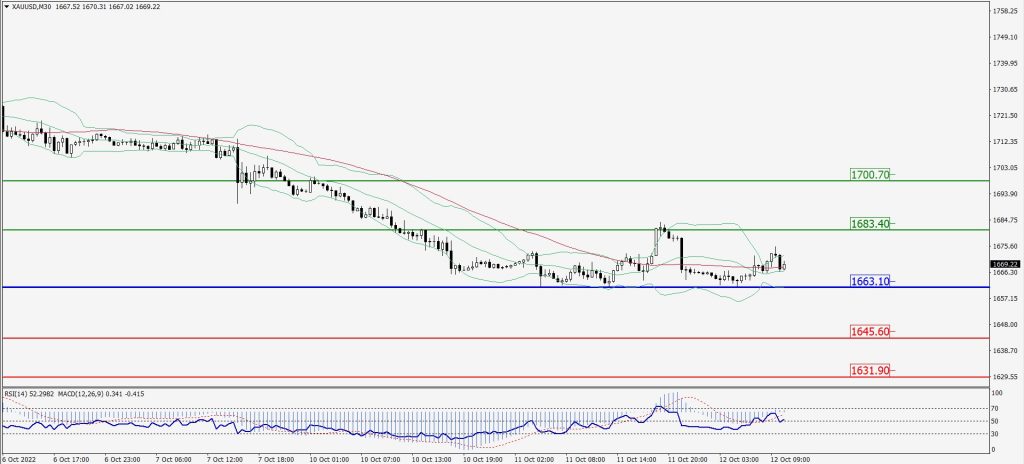
Green Lines Indicate Resistance Levels – Red Lines Indicate Support Levels
Light Blue is a Pivot Point – Black represents the price when the report was produced
Dow Jones Intraday: In a consolidation zone
Our pivot point is 29,247.00
Preferable Price Action: Take sell positions above pivot with targets at 29,635.00 & 29,912.00.
Alternative Price Action: Below 29,247.00 looks for further downside to 28,904.00 & 28,648.00.
Comment: RSI above 50 levels and Pairs above 55MA.
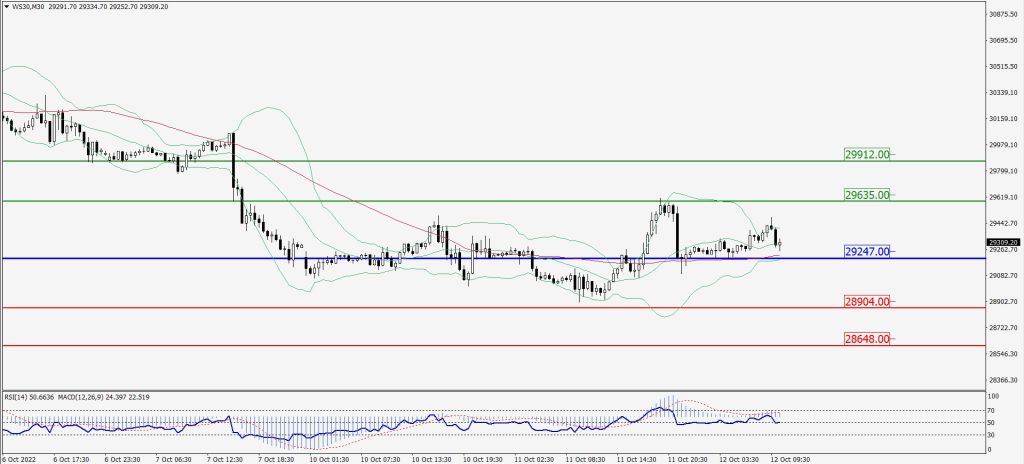
Green Lines Indicate Resistance Levels – Red Lines Indicate Support Levels
Light Blue is a Pivot Point – Black represents the price when the report was produced