Market Wrap: Stocks, Bonds, Commodities
The S&P 500 closed the books on its steepest September decline in two decades on Friday, skidding across the finish line of a tumultuous quarter fraught with historically hot inflation, rising interest rates and recession fears.
The Dow Jones Industrial Average fell 500.10 points to 28,725.51, the S&P 500 lose 54.85 points to 3,585.62 and the Nasdaq Composite subtract 161.89 points to 10,575.62.
MSCI’s index of Asia-Pacific stocks outside Japan is drop 0.90% to 652.95 levels. Australian index lower 0.27% to 6,456.90. Japanese Nikkei Index ascend 1.03% to 26,204.43.
European stocks were negative on Monday, with the Stoxx Europe 50 Index fell 1.41% to 3,270.56, Germany’s DAX drop 1.41% to 11,945.56, and France’s CAC down 1.51% to 5,675.36, and U.K.’s FTSE 100 slipped 0.98% to 6,825.90.
Benchmark 10-year U.S. Treasury fell as demand for safe assets ascend again, today 10-year bond yields a negative 0.14% to 3.7990.
Gas markets face “unprecedented” uncertainty this winter and into 2023 as dwindling levels of key Russian supplies drive up prices and disrupt trade flows, according to a new report from the International Energy Agency on Monday.
Spot Brent crude oil add 4.29% to $88.74 per barrel. US West Texas Intermediate crude is up 4.39% to $82.95 a barrel.
The yellow metal gold is advance 0.05% to 1,672.95 dollars per ounce.
Market Wrap: Forex
The U.S. dollar edged higher in early European trading Monday, while sterling also gained after the U.K. government agreed to water down its plans for unfunded tax cuts.
Today, the U.S. dollar index measures the Greenback against a trade-weighted basket of six major currencies, which is fell 0.09% to 111.980.
The Euro US Dollar (EUR/USD) is a widely traded pair that is up 0.16% today. This left the pair trading around $0.98140.
The Japanese yen was positive against the U.S. dollar on Monday as the stock up. Today USD/JPY is ascend 0.16% to 144.990 level.
Another commodity-related currency positive against the U.S dollar, AUD/USD surge 0.64% to 0.64420, and NZD/USD add 1.02 to 0.56520 level.
EUR/USD Intraday: In a consolidation zone
Our pivot point is at 0.97930
Preferable Price Action: Take buy positions above pivot level with targets at 0.98720 & 0.99320 in extension.
Alternative Price Action: Below pivot looks for a further downside to 0.97200 & 0.96660.
Comment: RSI at 50 levels and Pairs above 55MA.
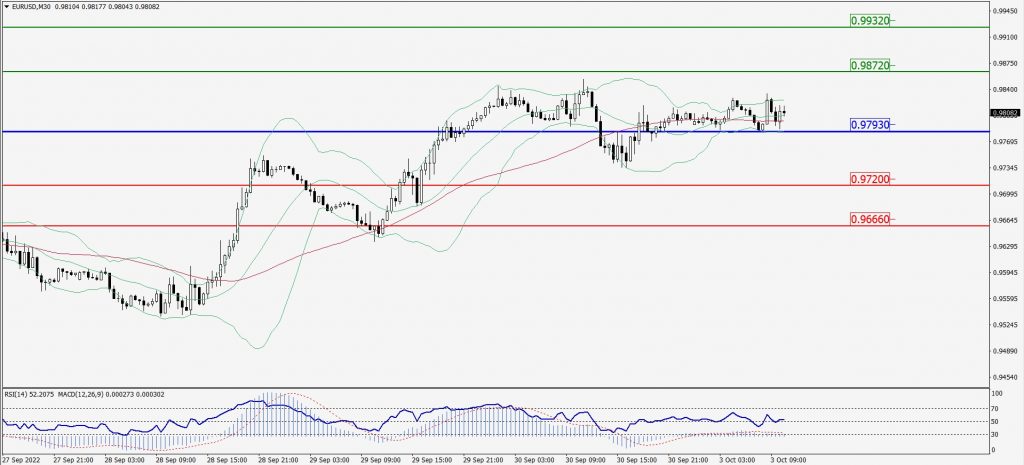
Green Lines Indicate Resistance Levels – Red Lines Indicate Support Levels
Light Blue is a Pivot Point – Black represents the price when the report was produced
GBP/USD Intraday: Trend on the upside
Our pivot point is at 1.11430
Preferable Price Action: Buy positions above pivot with targets at 1.13170 & 1.14550 in extension.
Alternative Price Action: The price below pivot would call for further downside to 1.09940 & 1.08810.
Comment: RSI above 50 levels and Pairs above its 20MA & 55MA.
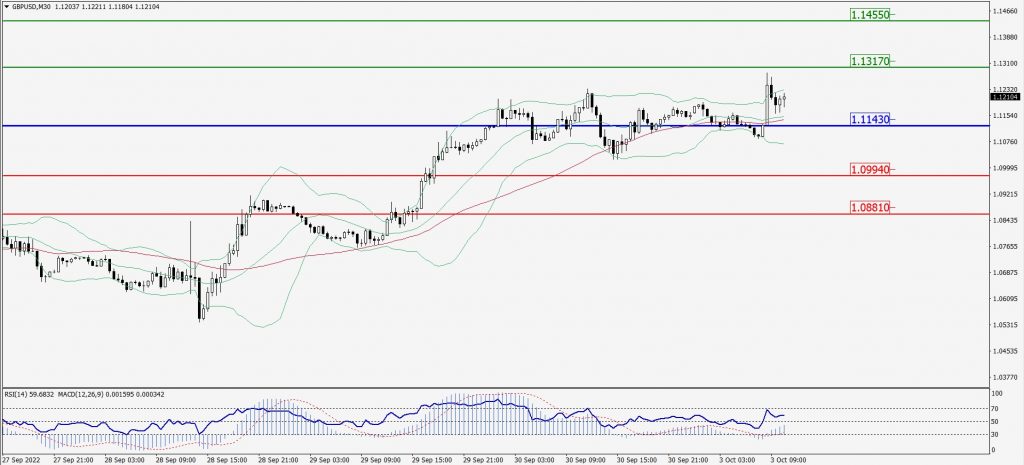
Green Lines Indicate Resistance Levels – Red Lines Indicate Support Levels
Light Blue is a Pivot Point – Black represents the price when the report was produced
USD/JPY Intraday: Trend on the upside
Our pivot point is at 144.830
Preferable Price Action: Buy position above pivot with the target at 145.230 and 145.460 in extension.
Alternative Price Action: The downside breakout of the pivot would call for 144.510 and 144.300.
Comment: MACD is positive territory and Pairs above its 20MA & 55MA.
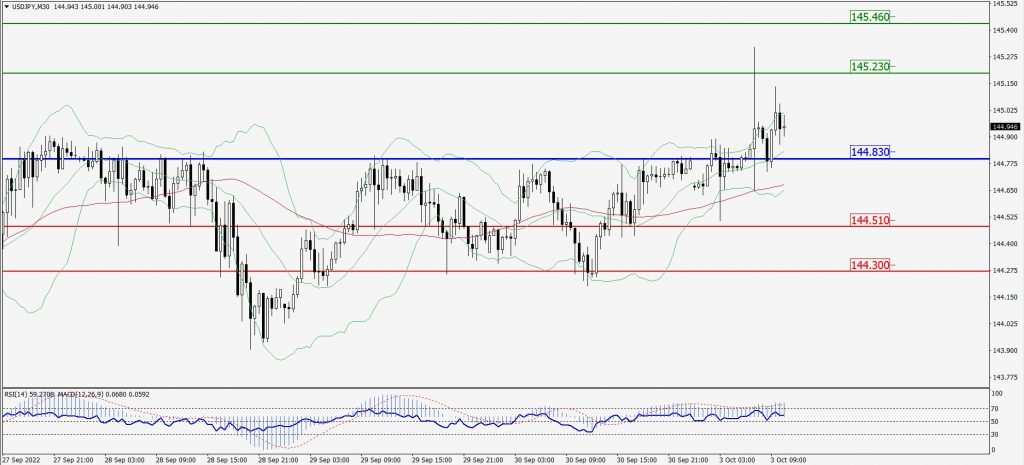
Green Lines Indicate Resistance Levels – Red Lines Indicate Support Levels
Light Blue is a Pivot Point – Black represents the price when the report was produced
AUD/USD Intraday: Support level at 0.64300
Our pivot point is at 0.64300
Preferable Price Action: Buy Positions above pivot with targets at 0.64740 & 0.65070 in extension.
Alternative Price Action: Below pivot looks for a further downside with 0.63860 & 0.63480 as targets.
Comment: RSI above 50 levels and Pairs above 20MA.
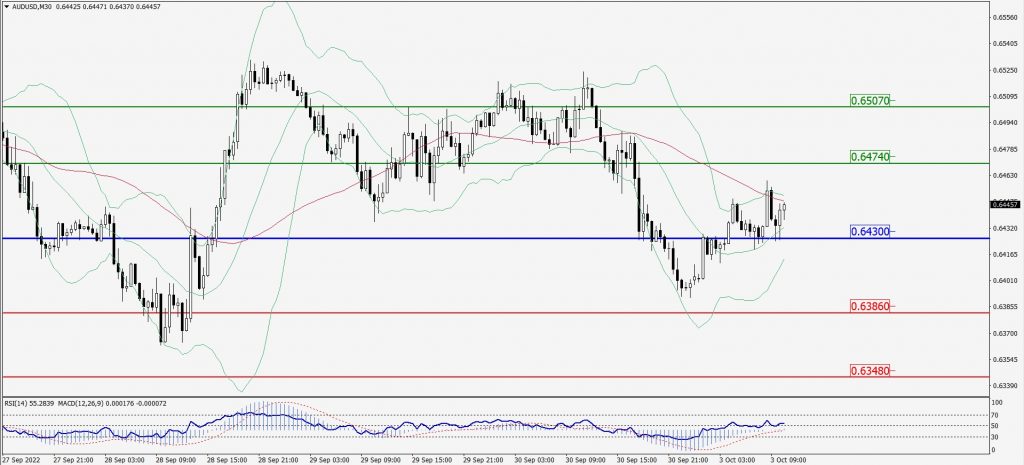
Green Lines Indicate Resistance Levels – Red Lines Indicate Support Levels
Light Blue is a Pivot Point – Black represents the price when the report was produced
CRUDEOIL Intraday: Trend on the upside
Our pivot point is at 81.87
Preferable Price Action: Above pivots buy oil with 84.27 & 86.24 as targets.
Alternative Price Action: Sell crude below pivot with targets at 80.07 and 78.49 in extension.
Comment: MACD is in the positive territory and Pairs above its 20MA & 55MA.
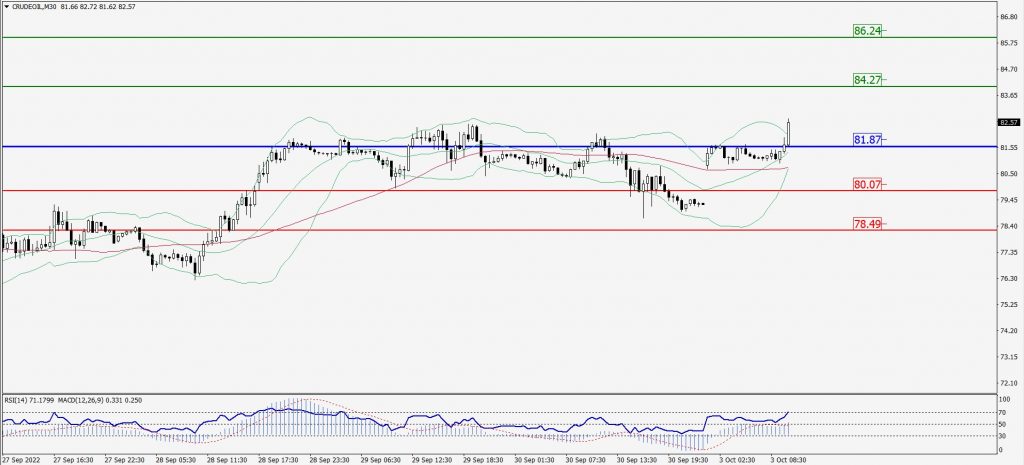
Green Lines Indicate Resistance Levels – Red Lines Indicate Support Levels
Light Blue is a Pivot Point – Black represents the price when the report was produced
XAU/USD Intraday: In a consolidation zone
Our pivot point is 1669.20
Preferable Price Action: Further downside to 1656.20 and 1647.00
Alternative Price Action: If the price gives an upside breakout of a pivot, then the price extends to 1680.10 and 1689.20.
Comment: MACD is flat territory and Pairs below 55MA.
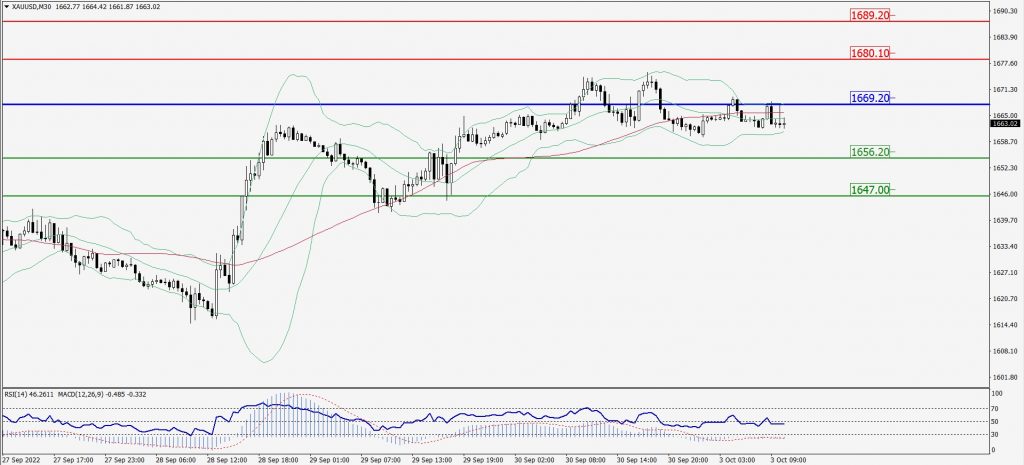
Green Lines Indicate Resistance Levels – Red Lines Indicate Support Levels
Light Blue is a Pivot Point – Black represents the price when the report was produced
Dow Jones Intraday: Trend on the downside
Our pivot point is 28,993.00
Preferable Price Action: Take sell positions below pivot with targets at 28,654.00 & 28,392.00.
Alternative Price Action: Above 28,993.00 looks for further upside to 29,271.00 & 29,496.00.
Comment: RSI below 50 levels and Pairs below 55MA.
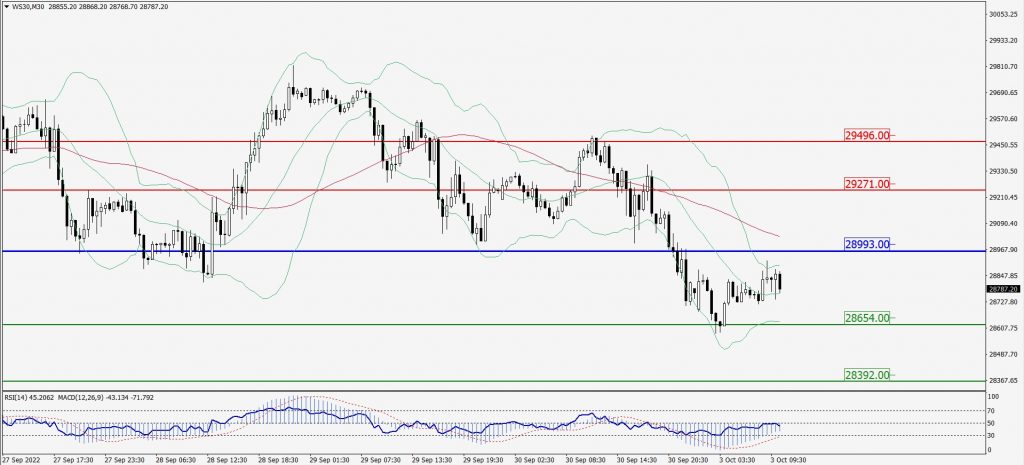
Green Lines Indicate Resistance Levels – Red Lines Indicate Support Levels
Light Blue is a Pivot Point – Black represents the price when the report was produced