Market Wrap: Stocks, Bonds, Commodities
European shares opened lower on Thursday, with tech stocks leading the declines, after the U.S. Federal Reserve delivered another jumbo-sized interest rate hike and signalled more increases in its fight against stubbornly high inflation.
The Dow Jones Industrial Average fell 522.45 points to 30,183.78, the S&P 500 lose 66.00 points to 3,789.93 and the Nasdaq Composite subtract 204.86 points to 11,220.19.
MSCI’s index of Asia-Pacific stocks outside Japan is drop 1.59% to 687.64 levels. Australian index lower 1.56% to 6,700.20. Japanese Nikkei Index drop 0.58% to 27,153.83.
European stocks were negative on Thursday, with the Stoxx Europe 50 Index fell 0.48% to 3,474.25, Germany’s DAX drop 0.43% to 12,711.26, and France’s CAC subtract 0.58% to 5,996.62, and U.K.’s FTSE 100 slipped 0.37% to 7,210.80.
Benchmark 10-year U.S. Treasury fell as demand for safe assets ascend again, today 10-year bond yields a positive 1.02% to 3.5480.
Oil rebounded on Thursday after sliding 1% in the previous session as concerns over tight supplies heading into winter eclipsed fears of a global recession.
Spot Brent crude oil add 0.90% to $90.61 per barrel. US West Texas Intermediate crude is up 0.94% to $83.72 a barrel.
The yellow metal gold is decline 0.58% to 1,666.00 dollars per ounce.
Market Wrap: Forex
The U.S. dollar soared in early European trading Thursday, posting a new 24-year high against the yen after the Federal Reserve’s hawkish interest-rate projections contrasted with the Bank of Japan’s dovish stance.
Today, the U.S. dollar index measures the Greenback against a trade-weighted basket of six major currencies, which is rose 0.90% to 111.350.
The Euro US Dollar (EUR/USD) is a widely traded pair that is up 0.04% today. This left the pair trading around $0.98420.
The Japanese yen was positive against the U.S. dollar on Thursday as the stock up. Today USD/JPY is ascend 1.20% to 145.770 level.
Another commodity-related currency negative against the U.S dollar, AUD/USD slipped 0.30% to 0.66080, and NZD/USD down 0.38 to 0.58280 level.
EUR/USD Intraday: Trend on the downside
Our pivot point is at 0.98590
Preferable Price Action: Take sell positions below pivot level with targets at 0.97900 & 0.97400 in extension.
Alternative Price Action: Above pivot looks for a further upside to 0.99150 & 0.99630.
Comment: RSI below 50 levels and Pairs below 55MA.
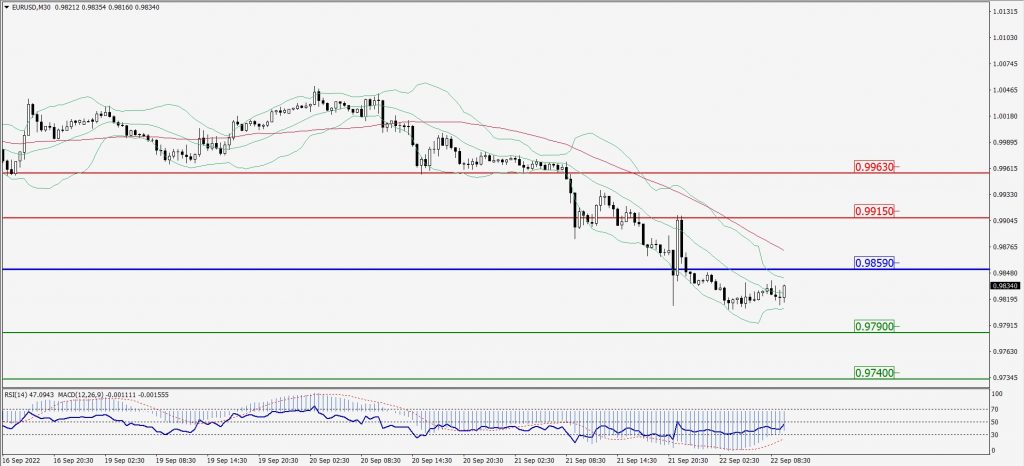
Green Lines Indicate Resistance Levels – Red Lines Indicate Support Levels
Light Blue is a Pivot Point – Black represents the price when the report was produced
GBP/USD Intraday: Trend on the downside
Our pivot point is at 1.12700
Preferable Price Action: Sell positions below pivot with targets at 1.11890 & 1.11400 in extension.
Alternative Price Action: The price above pivot would call for further upside to 1.13460 & 1.13920.
Comment: RSI below 50 levels and Pairs below 55MA.
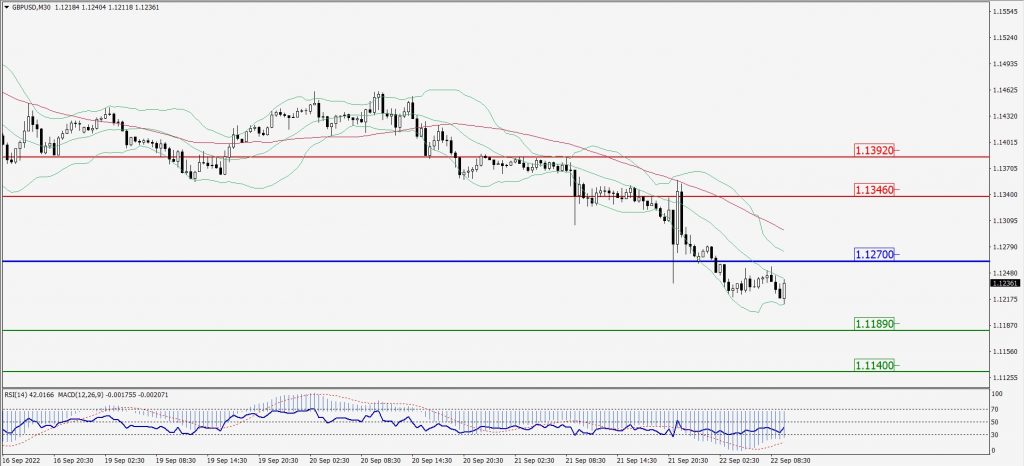
Green Lines Indicate Resistance Levels – Red Lines Indicate Support Levels
Light Blue is a Pivot Point – Black represents the price when the report was produced
USD/JPY Intraday: Major trend on the upside
Our pivot point is at 145.360
Preferable Price Action: Buy position above pivot with the target at 146.870 and 147.980 in extension.
Alternative Price Action: The downside breakout of the pivot would call for 144.160 and 143.190.
Comment: MACD is positive territory and Pairs above its 20MA & 55MA.
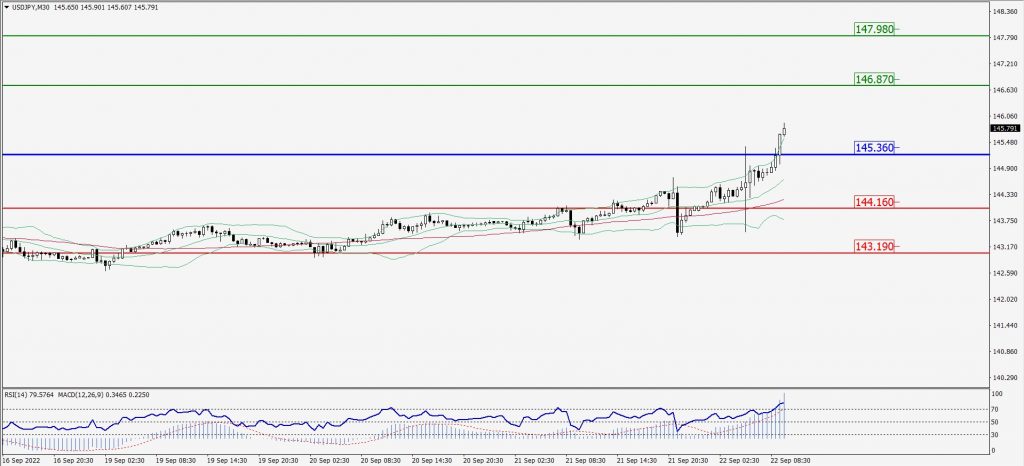
Green Lines Indicate Resistance Levels – Red Lines Indicate Support Levels
Light Blue is a Pivot Point – Black represents the price when the report was produced
AUD/USD Intraday: Resistance level at 0.66110
Our pivot point is at 0.66110
Preferable Price Action: Sell Positions below pivot with targets at 0.65550 & 0.65160 in extension.
Alternative Price Action: Above pivot looks for a further upside with 0.66570 & 0.66950 as targets.
Comment: RSI below 50 levels and Pairs below its 20MA & 55MA.
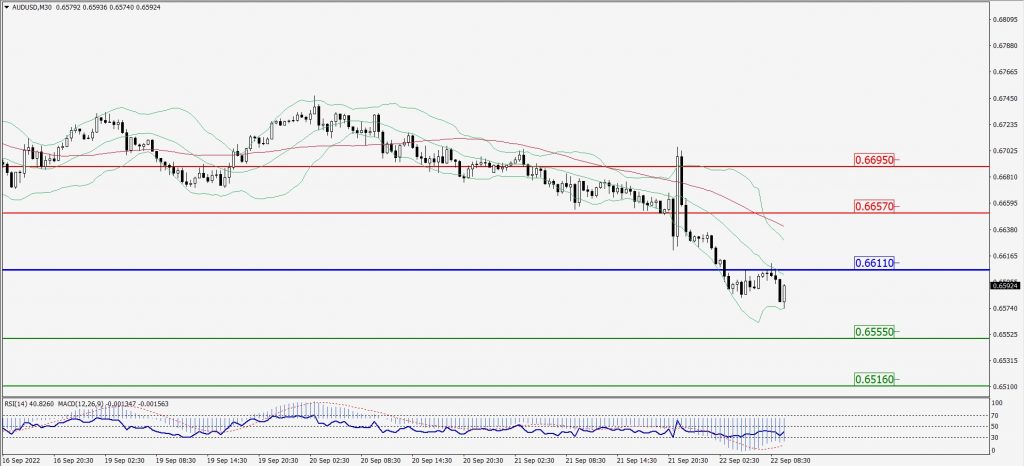
Green Lines Indicate Resistance Levels – Red Lines Indicate Support Levels
Light Blue is a Pivot Point – Black represents the price when the report was produced
CRUDEOIL Intraday: In a consolidation zone
Our pivot point is at 83.50
Preferable Price Action: Below pivots sell oil with 81.71 & 80.44 as targets.
Alternative Price Action: Buy crude above pivot with targets at 85.02 and 86.16 in extension.
Comment: MACD is in the negative territory and Pairs below 55MA.
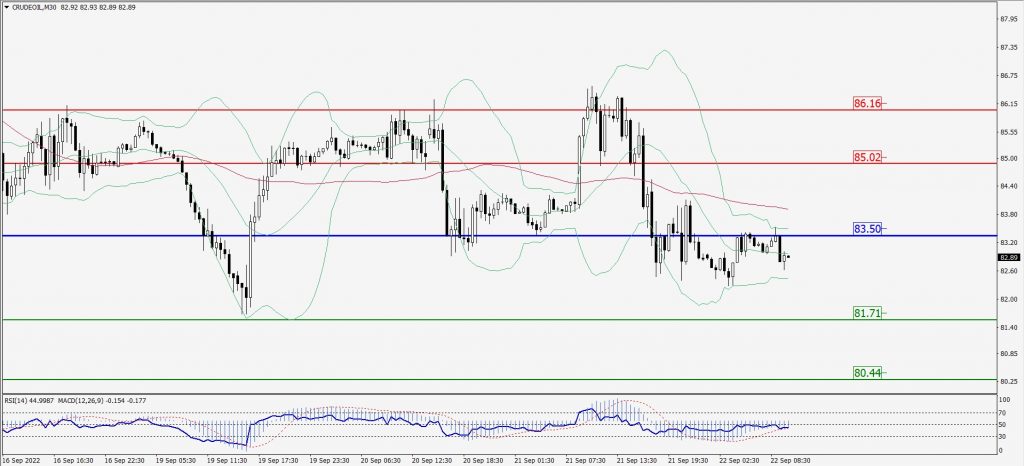
Green Lines Indicate Resistance Levels – Red Lines Indicate Support Levels
Light Blue is a Pivot Point – Black represents the price when the report was produced
XAU/USD Intraday: Trend on the downside
Our pivot point is 1666.00
Preferable Price Action: Further downside to 1654.50 and 1645.90
Alternative Price Action: If the price gives an upside breakout of a pivot, then the price extends to 1676.20 and 1684.90.
Comment: MACD is negative territory and Pairs below its 20MA & 55MA.
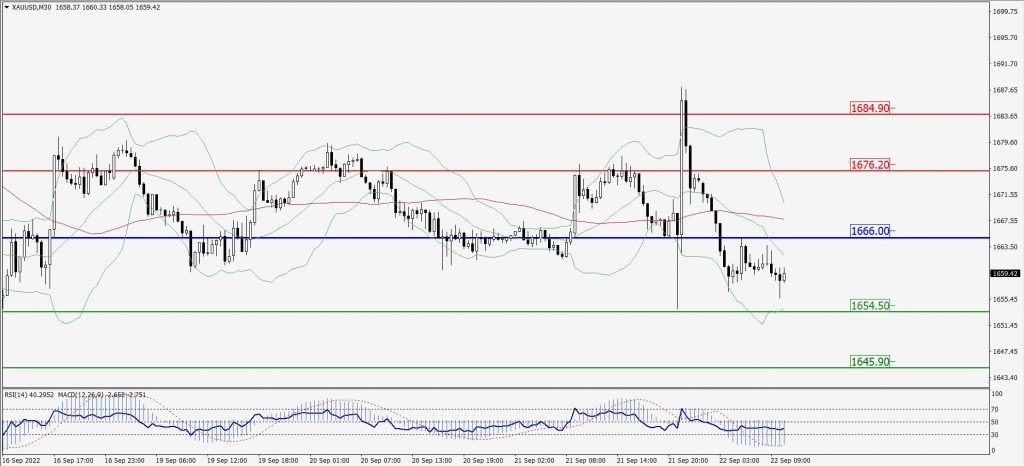
Green Lines Indicate Resistance Levels – Red Lines Indicate Support Levels
Light Blue is a Pivot Point – Black represents the price when the report was produced
Dow Jones Intraday: Trend on the downside
Our pivot point is 30,249.00
Preferable Price Action: Take sell positions below pivot with targets at 29,963.00 & 29,784.00.
Alternative Price Action: Above 30,249.00 looks for further upside to 30,495.00 & 30,689.00.
Comment: RSI below 50 levels and Pairs below 55MA.
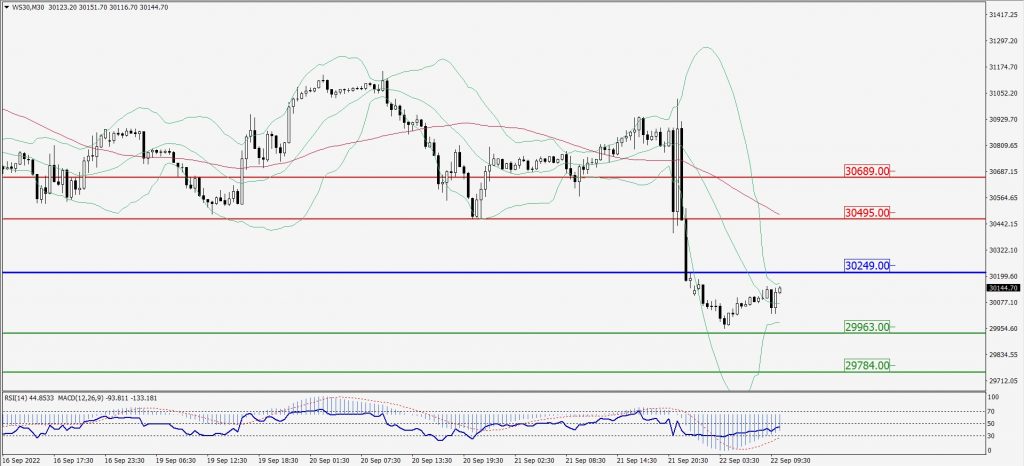
Green Lines Indicate Resistance Levels – Red Lines Indicate Support Levels
Light Blue is a Pivot Point – Black represents the price when the report was produced