Market Wrap: Stocks, Bonds, Commodities
Wall Street indices were firmly in the red after a choppy start to Thursday’s session while bond yields rose as investors digested economic data that provided the Federal Reserve little reason to ease its aggressive interest rate hiking cycle.
The Dow Jones Industrial Average fell 173.27 points to 30,961.82, the S&P 500 lose 44.66 points to 3,901.35 and the Nasdaq Composite subtract 167.32 points to 11,552.36.
MSCI’s index of Asia-Pacific stocks outside Japan is drop 1.25% to 607.45 levels. Australian index lower 1.52% to 6,739.10. Japanese Nikkei Index drop 1.11% to 27,567.65.
European stocks were negative on Friday, with the Stoxx Europe 50 Index fell 1.35% to 3,494.05, Germany’s DAX drop 1.69% to 12,738.31, and France’s CAC subtract 1.30% to 6,077.85, and U.K.’s FTSE 100 slipped 0.06% to 7,277.17.
Benchmark 10-year U.S. Treasury fell as demand for safe assets ascend again, today 10-year bond yields a positive 0.29% to 3.4690.
Oil fell more than 2 percent on Thursday as expectations of weaker demand and a strong US dollar ahead of a potentially large interest rate increase outweighed supply concerns.
Spot Brent crude oil subtract 0.45% to $90.44 per barrel. US West Texas Intermediate crude is down 0.66% to $84.55 a barrel.
The yellow metal gold is decline 0.83% to 1,663.40 dollars per ounce.
Market Wrap: Forex
The U.S. dollar strengthened in early European trade Friday, while the Chinese yuan broke through a crucial threshold as concerns over rising interest rates and a potential recession dented risk appetite.
Today, the U.S. dollar index measures the Greenback against a trade-weighted basket of six major currencies, which is rose 0.35% to 109.830.
The Euro US Dollar (EUR/USD) is a widely traded pair that is down 0.35% today. This left the pair trading around $0.99640.
The Japanese yen was positive against the U.S. dollar on Friday as the stock up. Today USD/JPY is drop 0.11% to 143.380 level.
Another commodity-related currency negative against the U.S dollar, AUD/USD slipped 0.40% to 0.66750, and NZD/USD down 0.23 to 0.59530 level.
EUR/USD Intraday: Major resistance level at 1.00130
Our pivot point is at 1.00130
Preferable Price Action: Take sell positions below pivot level with targets at 0.99130 & 0.98330 in extension.
Alternative Price Action: Above pivot looks for a further upside to 1.01130 & 1.01920.
Comment: RSI below 50 levels and Pairs below its 20MA & 55MA.
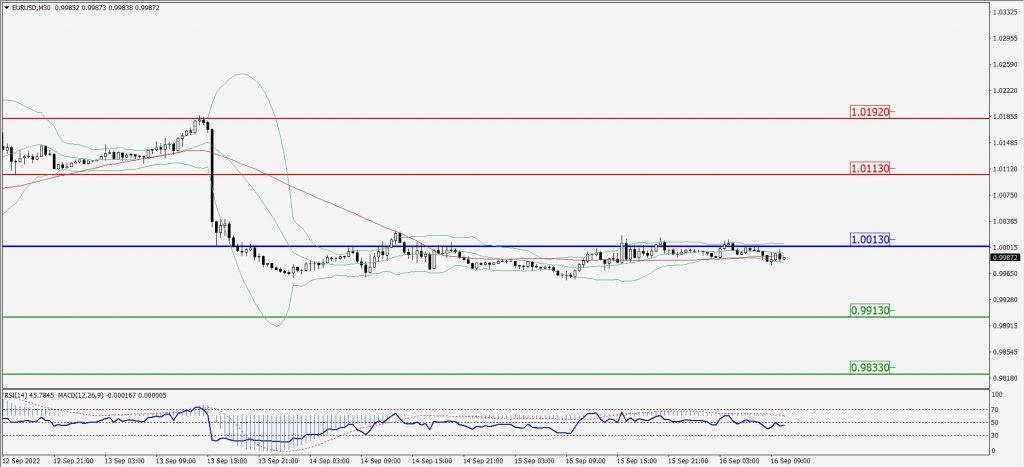
Green Lines Indicate Resistance Levels – Red Lines Indicate Support Levels
Light Blue is a Pivot Point – Black represents the price when the report was produced
GBP/USD Intraday: Trend on the downside
Our pivot point is at 1.14850
Preferable Price Action: Sell positions below pivot with targets at 1.13550 & 1.12540 in extension.
Alternative Price Action: The price above pivot would call for further downside to 1.16030 & 1.16820.
Comment: RSI below 50 levels and Pairs below its 20MA & 55MA.
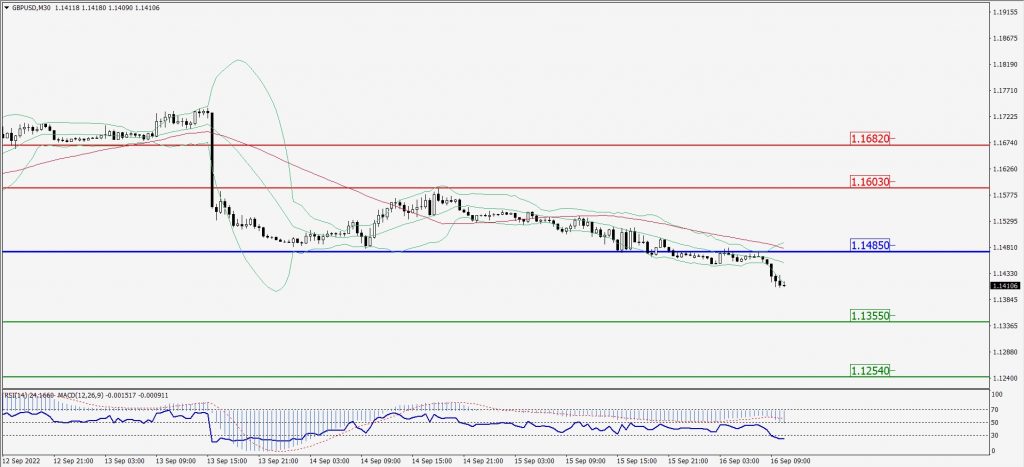
Green Lines Indicate Resistance Levels – Red Lines Indicate Support Levels
Light Blue is a Pivot Point – Black represents the price when the report was produced
USD/JPY Intraday: In a consolidation zone
Our pivot point is at 143.620
Preferable Price Action: Sell position below pivot with the target at 142.770 and 142.180 in extension.
Alternative Price Action: The upside breakout of the pivot would call for 144.420 and 145.000.
Comment: MACD is flat territory and Pairs below 55MA.
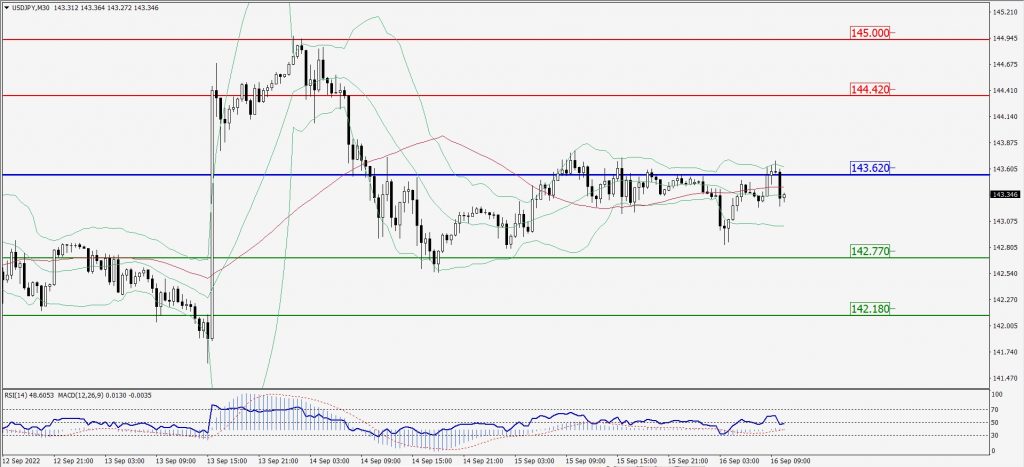
Green Lines Indicate Resistance Levels – Red Lines Indicate Support Levels
Light Blue is a Pivot Point – Black represents the price when the report was produced
AUD/USD Intraday: Trend on the downside
Our pivot point is at 0.67270
Preferable Price Action: Sell Positions below pivot with targets at 0.66280 & 0.65580 in extension.
Alternative Price Action: Above pivot looks for a further upside with 0.67980 & 0.68650 as targets.
Comment: RSI below 50 levels and Pairs below its 20MA & 55MA.
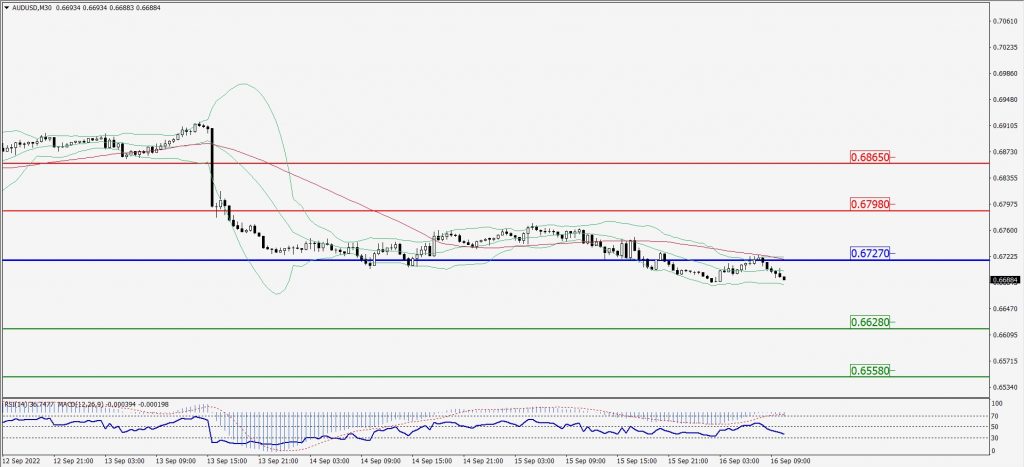
Green Lines Indicate Resistance Levels – Red Lines Indicate Support Levels
Light Blue is a Pivot Point – Black represents the price when the report was produced
CRUDEOIL Intraday: In a consolidation zone
Our pivot point is at 85.83
Preferable Price Action: Below pivots sell oil with 83.72 & 82.14 as targets.
Alternative Price Action: Buy crude above pivot with targets at 87.59 and 88.94 in extension.
Comment: MACD is in the flat territory and Pairs below 55MA.
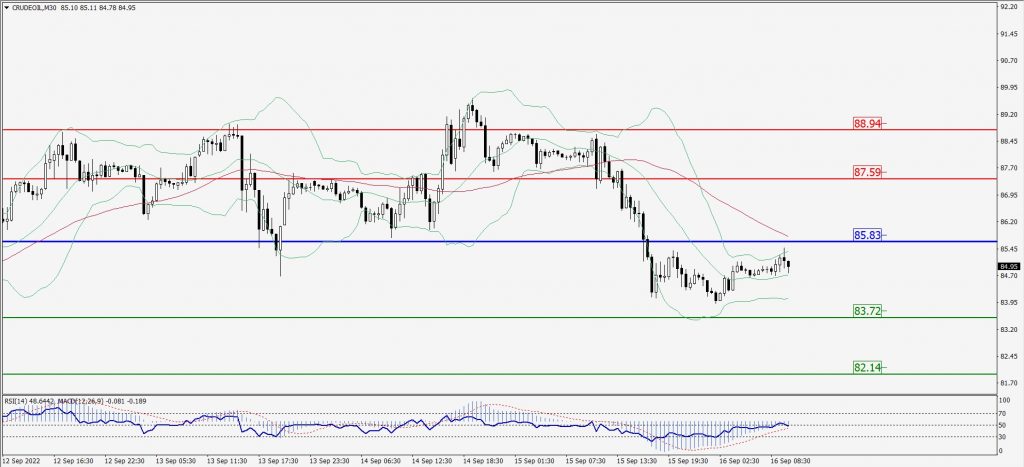
Green Lines Indicate Resistance Levels – Red Lines Indicate Support Levels
Light Blue is a Pivot Point – Black represents the price when the report was produced
XAU/USD Intraday: Trend on the downside
Our pivot point is 1670.40
Preferable Price Action: Further downside to 1644.00 and 1624.90
Alternative Price Action: If the price gives an upside breakout of a pivot, then the price extends to 1692.50 and 1712.60.
Comment: MACD is negative territory and Pairs below its 20MA & 55MA.
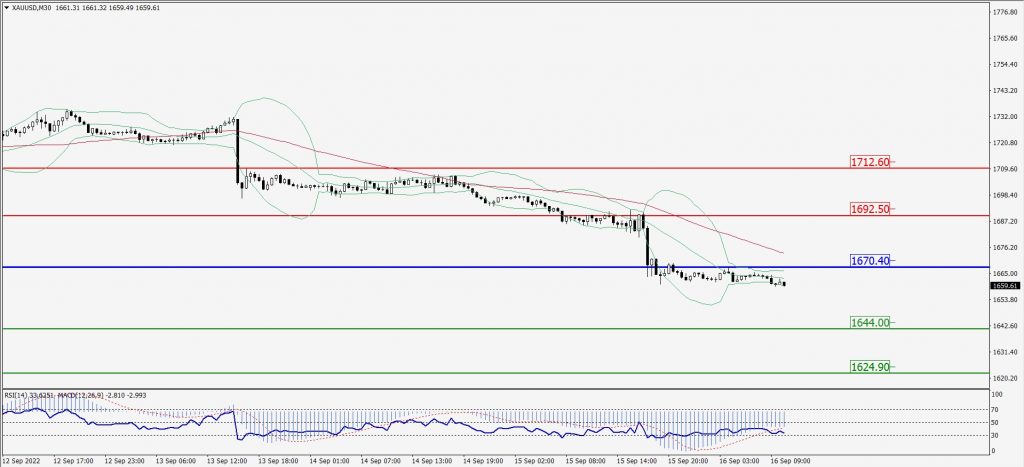
Green Lines Indicate Resistance Levels – Red Lines Indicate Support Levels
Light Blue is a Pivot Point – Black represents the price when the report was produced
Dow Jones Intraday: Trend on the downside
Our pivot point is 30,961.00
Preferable Price Action: Take sell positions below pivot with targets at 30,395.00 & 30,010.00.
Alternative Price Action: Above 30,961.00 looks for further upside to 31,526.00 & 31,978.00.
Comment: RSI below 50 levels and Pairs below its 20MA & 55MA.
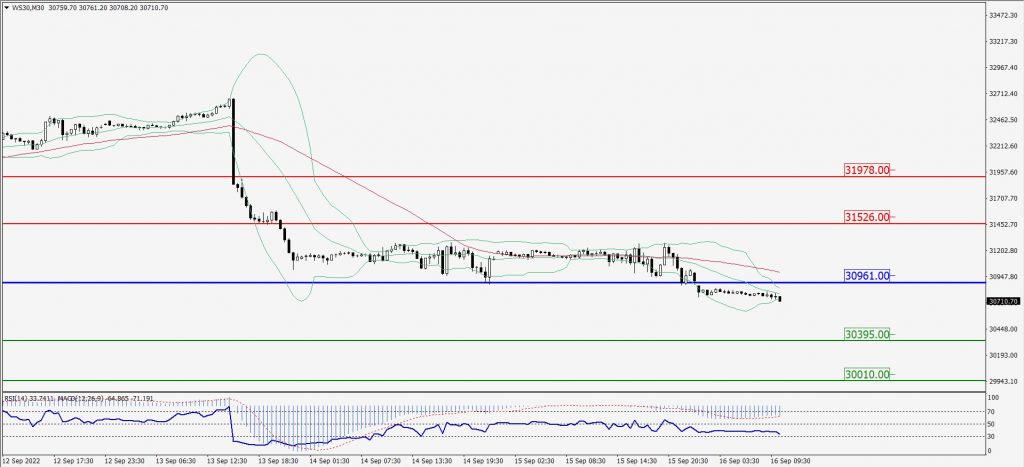
Green Lines Indicate Resistance Levels – Red Lines Indicate Support Levels
Light Blue is a Pivot Point – Black represents the price when the report was produced