Market Wrap: Stocks, Bonds, Commodities
US stocks rallied on Friday, with the major indices recording their first weekly gain in four weeks as investors went on a buying spree, shrugging off concerns about the economic outlook.
The Dow Jones Industrial Average rose 377.19 points to 32,151.71, the S&P 500 gain 61.18 points to 4,067.36 and the Nasdaq Composite add 250.18 points to 12,112.31.
MSCI’s index of Asia-Pacific stocks outside Japan is ascend 0.51% to 625.63 levels. Australian index higher 1.02% to 6,964.50. Japanese Nikkei Index ascend 1.16% to 28,542.11.
European stocks were positive on Monday, with the Stoxx Europe 50 Index rose 1.11% to 3,609.75, Germany’s DAX ascend 1.33% to 13,263.26, and France’s CAC add 1.06% to 6,278.05, and U.K.’s FTSE 100 surged 1.15% to 7,436.80.
Benchmark 10-year U.S. Treasury fell as demand for safe assets ascend again, today 10-year bond yields a negative 0.28% to 3.3120.
Oil prices fell on Monday with the global fuel demand outlook overshadowed by COVID-19 restrictions in China and the potential for further interest rate hikes in the United States and Europe.
Spot Brent crude oil add 0.14% to $92.97 per barrel. US West Texas Intermediate crude is down 0.02% to $86.75 a barrel.
The yellow metal gold is advance 0.30% to 1,733.70 dollars per ounce.
Market Wrap: Forex
The U.S. dollar weakened in early European trade Monday, while the euro jumped to a three-week high as traders reassessed the European Central Bank’s interest rate trajectory in the wake of last week’s jumbo rate hike.
Today, the U.S. dollar index measures the Greenback against a trade-weighted basket of six major currencies, which is fell 0.90% to 107.730.
The Euro US Dollar (EUR/USD) is a widely traded pair that is up 1.36% today. This left the pair trading around $1.01750.
The Japanese yen was positive against the U.S. dollar on Monday as the stock up. Today USD/JPY is ascend 0.24% to 142.860 level.
Another commodity-related currency positive against the U.S dollar, AUD/USD surged 0.58% to 0.68820, and NZD/USD up 0.57 to 0.61460 level.
EUR/USD Intraday: Trend on the upside
Our pivot point is at 1.01580
Preferable Price Action: Take buy positions above pivot level with targets at 1.02700 & 1.03380 in extension.
Alternative Price Action: Below pivot looks for a further downside to 1.00570 & 0.99850.
Comment: RSI above 50 levels and Pairs above its 20MA & 55MA.
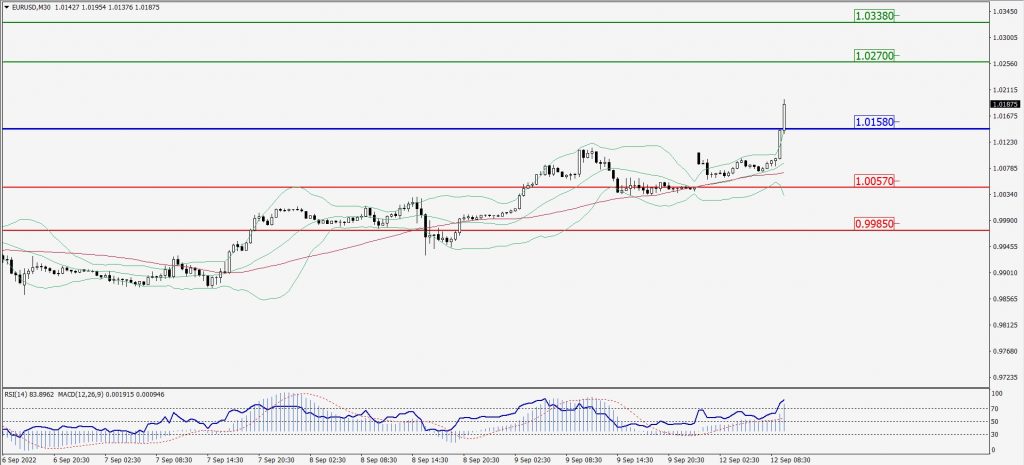
Green Lines Indicate Resistance Levels – Red Lines Indicate Support Levels
Light Blue is a Pivot Point – Black represents the price when the report was produced
GBP/USD Intraday: Trend on the upside
Our pivot point is at 1.16650
Preferable Price Action: Buy positions above pivot with targets at 1.17830 & 1.18610 in extension.
Alternative Price Action: The price below pivot would call for further downside to 1.15450 & 1.14870.
Comment: RSI above 50 levels and Pairs above its 20MA & 55MA.
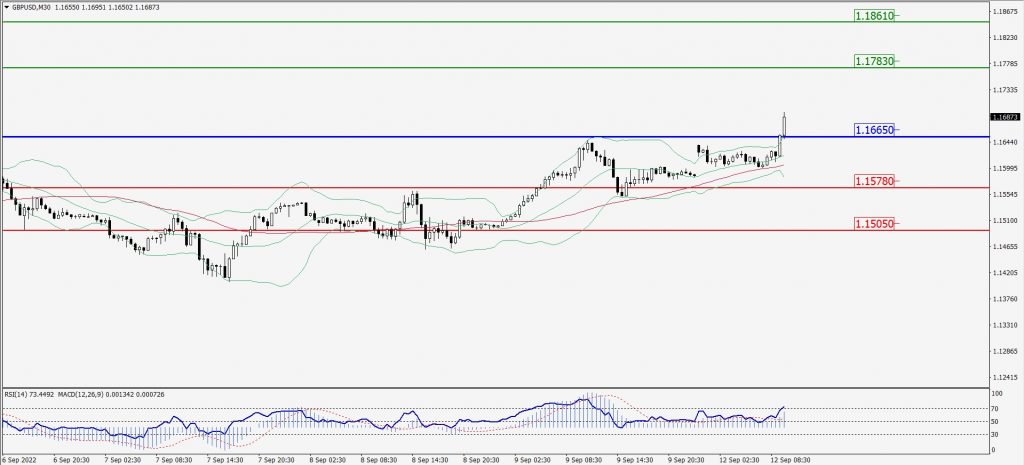
Green Lines Indicate Resistance Levels – Red Lines Indicate Support Levels
Light Blue is a Pivot Point – Black represents the price when the report was produced
USD/JPY Intraday: Trend on the downside
Our pivot point is at 143.270
Preferable Price Action: Sell position below pivot with the target at 141.860 and 140.870 in extension.
Alternative Price Action: The upside breakout of the pivot would call for 144.600 and 145.500.
Comment: MACD is negative territory and Pairs below 20MA.
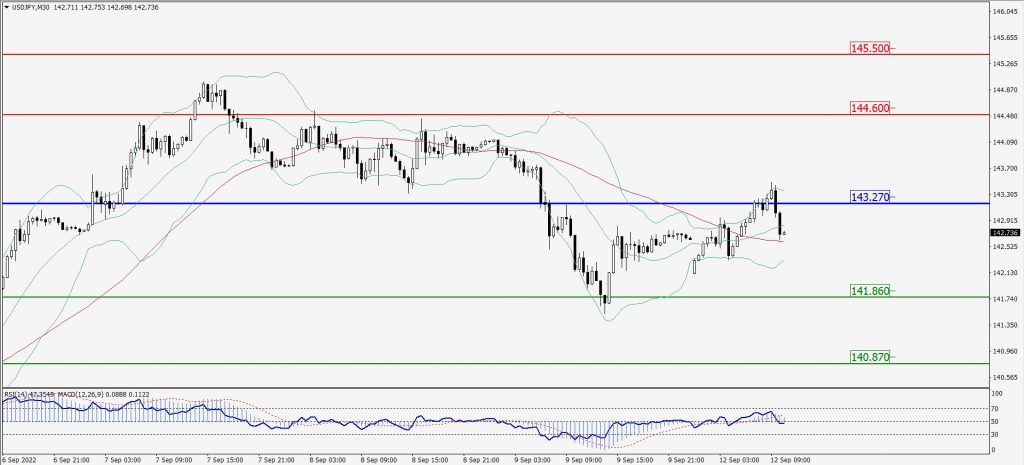
Green Lines Indicate Resistance Levels – Red Lines Indicate Support Levels
Light Blue is a Pivot Point – Black represents the price when the report was produced
AUD/USD Intraday: Trend on the upside
Our pivot point is at 0.68720
Preferable Price Action: Buy Positions above pivot with targets at 0.69440 & 0.70070 in extension.
Alternative Price Action: Below pivot looks for a further downside with 0.68140 & 0.67640 as targets.
Comment: RSI above 50 levels and Pairs above its 20MA & 55MA.
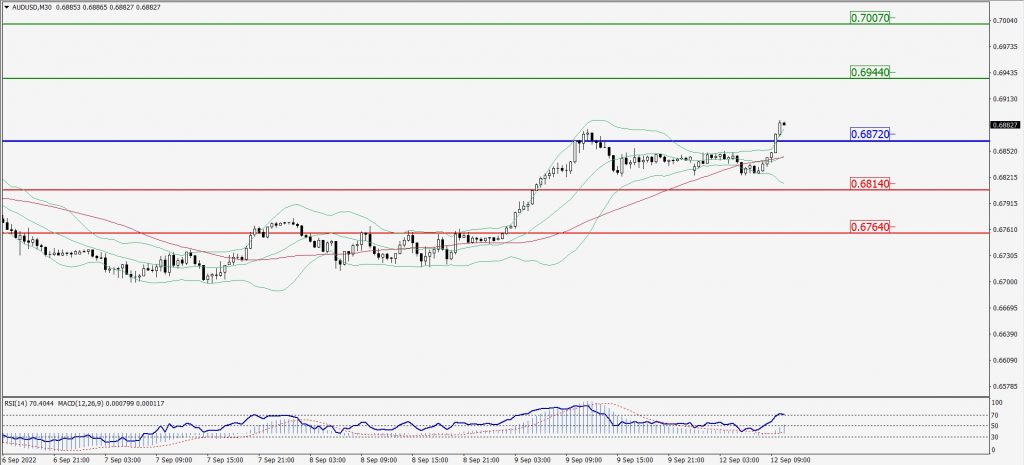
Green Lines Indicate Resistance Levels – Red Lines Indicate Support Levels
Light Blue is a Pivot Point – Black represents the price when the report was produced
CRUDEOIL Intraday: Support level at 86.01
Our pivot point is at 86.01
Preferable Price Action: Above pivots buy oil with 88.40 & 90.23 as targets.
Alternative Price Action: Sell crude below pivot with targets at 84.05 and 82.44 in extension.
Comment: MACD is in the positive territory and Pairs above its 20MA & 55MA.
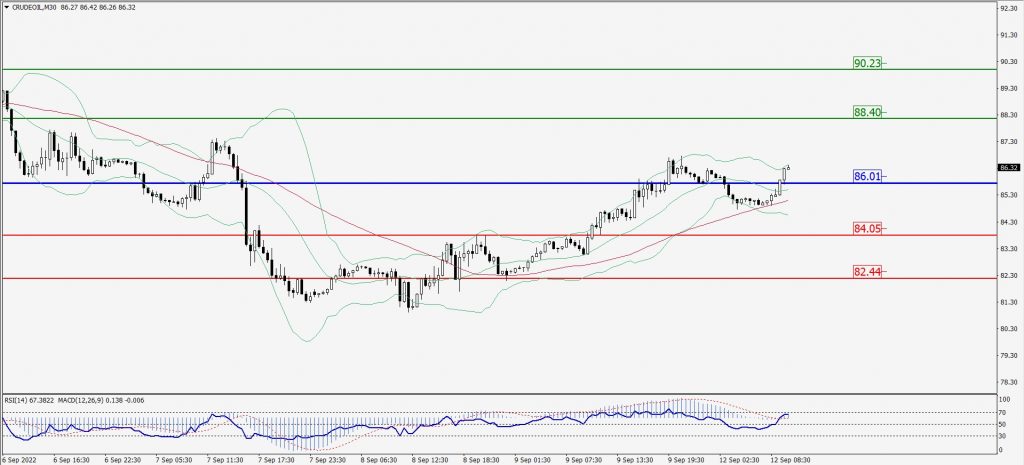
Green Lines Indicate Resistance Levels – Red Lines Indicate Support Levels
Light Blue is a Pivot Point – Black represents the price when the report was produced
XAU/USD Intraday: Trend on the upside
Our pivot point is 1722.70
Preferable Price Action: Further upside to 1739.40 and 1750.60
Alternative Price Action: If the price gives a downside breakout of a pivot, then the price extends to 1708.00 and 1697.10.
Comment: MACD is positive territory and Pairs above its 20MA & 55MA.
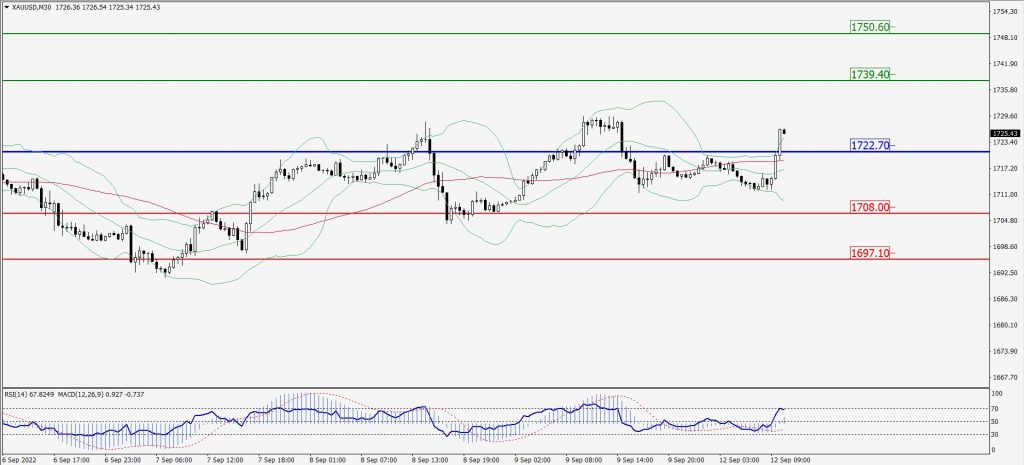
Green Lines Indicate Resistance Levels – Red Lines Indicate Support Levels
Light Blue is a Pivot Point – Black represents the price when the report was produced
Dow Jones Intraday: Support level at 32,181.00
Our pivot point is 32,181.00
Preferable Price Action: Take buy positions above pivot with targets at 32,591.00 & 32,909.00.
Alternative Price Action: Below 32,181.00 looks for further downside to 31,859.00 & 31,568.00.
Comment: RSI above 50 levels and Pairs above its 20MA & 55MA.
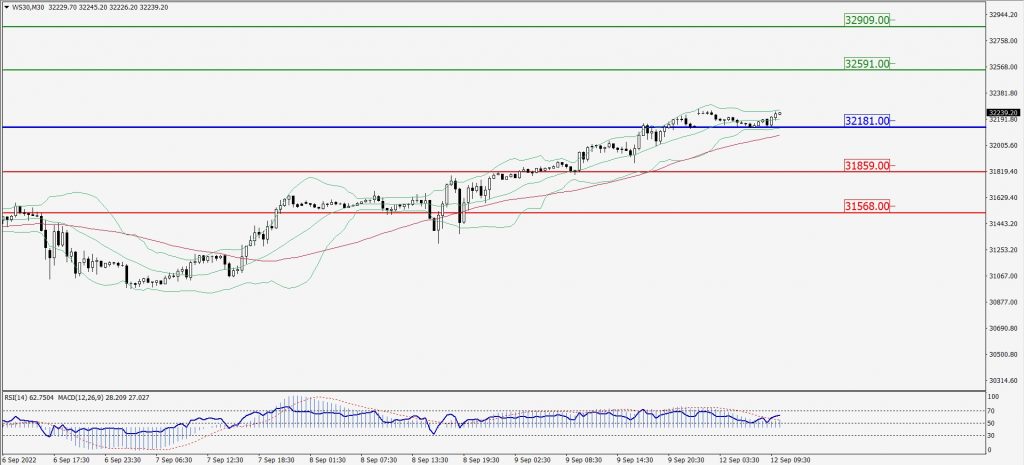
Green Lines Indicate Resistance Levels – Red Lines Indicate Support Levels
Light Blue is a Pivot Point – Black represents the price when the report was produced