Market Wrap: Stocks, Bonds, Commodities
US stock indexes climbed the most in roughly a month as bond yields eased, with investors shrugging off hawkish remarks made by Federal Reserve officials on Wednesday.
The Dow Jones Industrial Average rose 435.98 points to 31,581.28, the S&P 500 gain 71.68 points to 3,979.87 and the Nasdaq Composite add 246.99 points to 11,791.90.
MSCI’s index of Asia-Pacific stocks outside Japan is drop 0.05% to 613.81 levels. Australian index higher 1.77% to 6,848.70. Japanese Nikkei Index ascend 2.31% to 28,065.28.
European stocks were positive on Thursday, with the Stoxx Europe 50 Index rose 0.13% to 3,506.75, Germany’s DAX ascend 0.06% to 12,921.67, and France’s CAC add 0.16% to 6,115.83, and U.K.’s FTSE 100 surged 0.33% to 7,261.09.
Benchmark 10-year U.S. Treasury fell as demand for safe assets ascend again, today 10-year bond yields a positive 0.02% to 3.3190.
Oil prices settled sharply lower on Wednesday, slumping below levels seen prior to Russia’s invasion of Ukraine as downbeat Chinese trade data fed investor worries about recession risks.
Spot Brent crude oil subtract 0.26% to $87.78 per barrel. US West Texas Intermediate crude is down 0.20% to $81.78 a barrel.
The yellow metal gold is advance 0.07% to 1,728.80 dollars per ounce.
Market Wrap: Forex
The U.S. dollar edged lower in early European trade Thursday, with the euro rebounding ahead of the latest European Central Bank rate decision, which is expected to result in another aggressive increase.
Today, the U.S. dollar index measures the Greenback against a trade-weighted basket of six major currencies, which is fell 0.07% to 109.752.
The Euro US Dollar (EUR/USD) is a widely traded pair that is down 0.10% today. This left the pair trading around $0.99890.
The Japanese yen was positive against the U.S. dollar on Thursday as the stock up. Today USD/JPY is ascend 0.03% to 143.750 level.
Another commodity-related currency negative against the U.S dollar, AUD/USD slipped 0.52% to 0.67350, and NZD/USD down 0.43 to 0.60470 level.
EUR/USD Intraday: Trend on the downside
Our pivot point is at 1.00050
Preferable Price Action: Take sell positions below pivot level with targets at 0.99600 & 0.99270 in extension.
Alternative Price Action: Above pivot looks for a further upside to 1.00440 & 1.00700.
Comment: RSI below 50 levels and Pairs below 20MA.
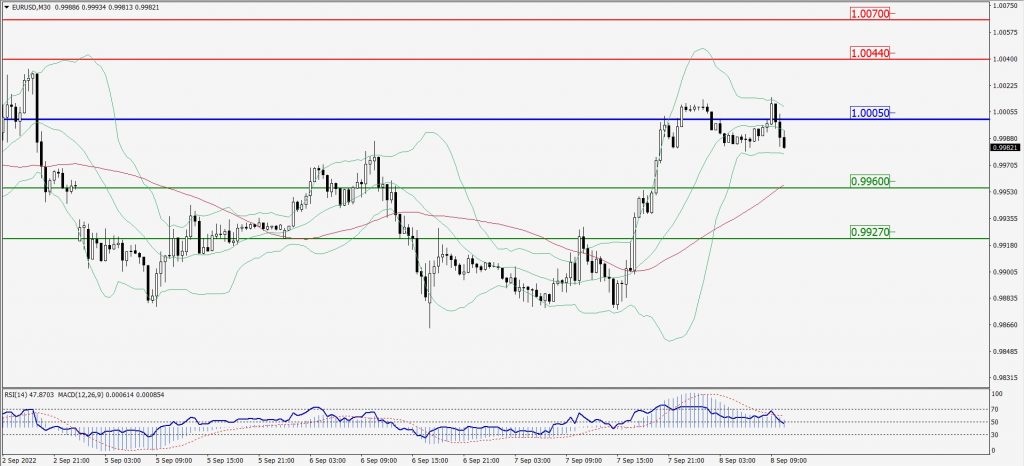
Green Lines Indicate Resistance Levels – Red Lines Indicate Support Levels
Light Blue is a Pivot Point – Black represents the price when the report was produced
GBP/USD Intraday: Trend on the downside
Our pivot point is at 1.15040
Preferable Price Action: Sell positions below pivot with targets at 1.14570 & 1.14230 in extension.
Alternative Price Action: The price above pivot would call for further upside to 1.15440 & 1.15810.
Comment: RSI below 50 levels and Pairs below 20MA.
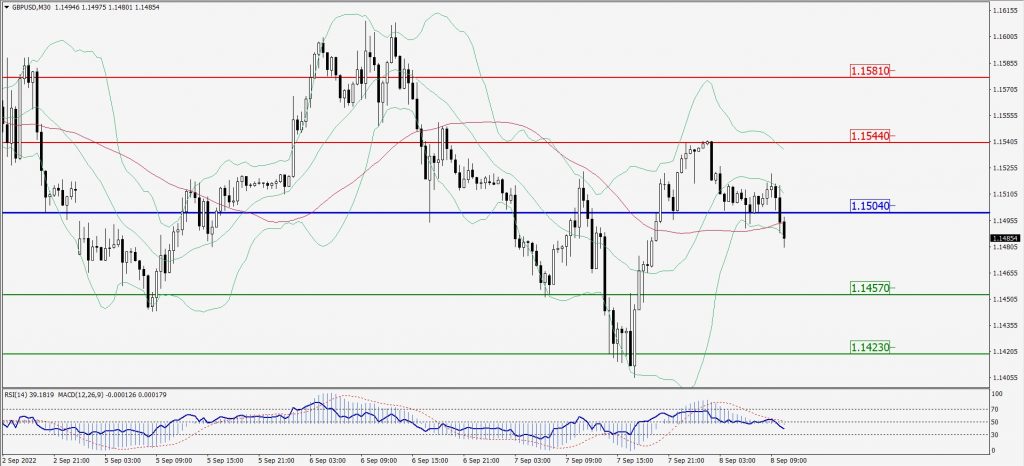
Green Lines Indicate Resistance Levels – Red Lines Indicate Support Levels
Light Blue is a Pivot Point – Black represents the price when the report was produced
USD/JPY Intraday: Trend on the downside
Our pivot point is at 144.160
Preferable Price Action: Sell position below pivot with the target at 143.260 and 142.560 in extension.
Alternative Price Action: The upside breakout of the pivot would call for 145.030 and 145.800.
Comment: MACD is negative territory and Pairs below its 20MA & 55MA.
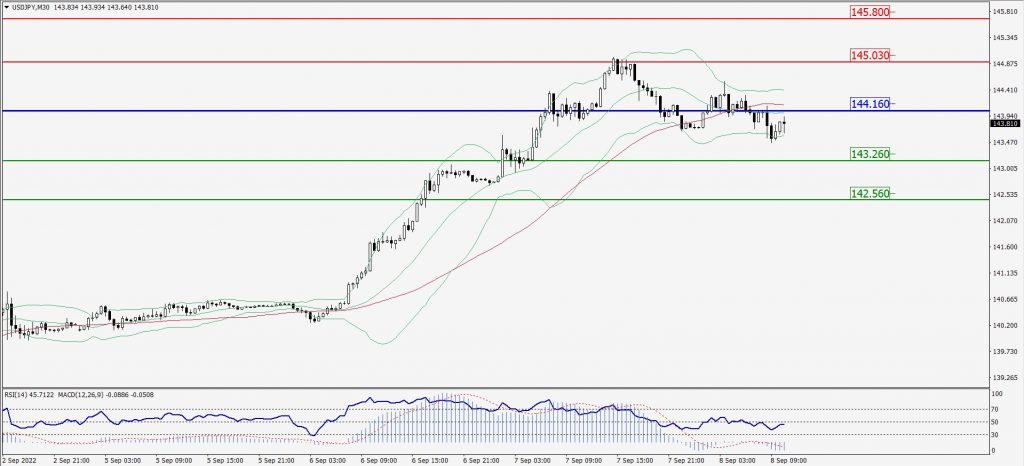
Green Lines Indicate Resistance Levels – Red Lines Indicate Support Levels
Light Blue is a Pivot Point – Black represents the price when the report was produced
AUD/USD Intraday: Trend on the downside
Our pivot point is at 0.67570
Preferable Price Action: Sell Positions below pivot with targets at 0.66930 & 0.66530 in extension.
Alternative Price Action: Above pivot looks for a further upside with 0.67980 & 0.68330 as targets.
Comment: RSI below 50 levels and Pairs below 20MA.
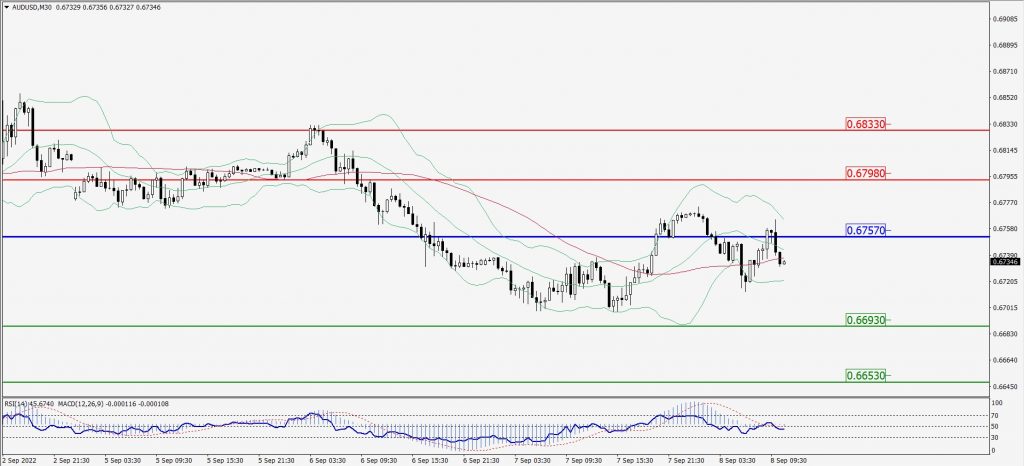
Green Lines Indicate Resistance Levels – Red Lines Indicate Support Levels
Light Blue is a Pivot Point – Black represents the price when the report was produced
CRUDEOIL Intraday: Trend on the downside
Our pivot point is at 83.43
Preferable Price Action: Below pivots sell oil with 80.65 & 78.41 as targets.
Alternative Price Action: Buy crude above pivot with targets at 85.88 and 87.94 in extension.
Comment: MACD is in the negative territory and Pairs below 55MA.
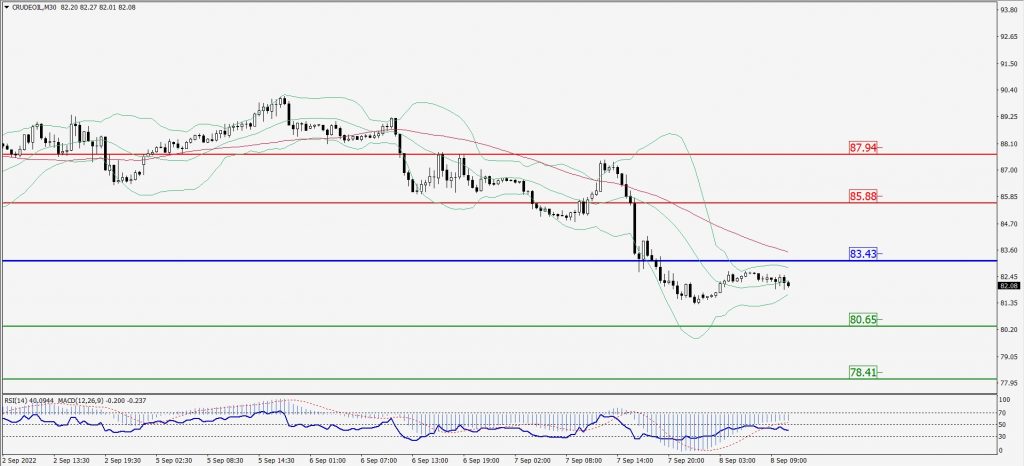
Green Lines Indicate Resistance Levels – Red Lines Indicate Support Levels
Light Blue is a Pivot Point – Black represents the price when the report was produced
XAU/USD Intraday: Trend on the upside
Our pivot point is 1714.80
Preferable Price Action: Further upside to 1728.50 and 1737.80
Alternative Price Action: If the price gives a downside breakout of a pivot, then the price extends to 1703.30 and 1694.40.
Comment: MACD is positive territory and Pairs above its 20MA & 55MA.
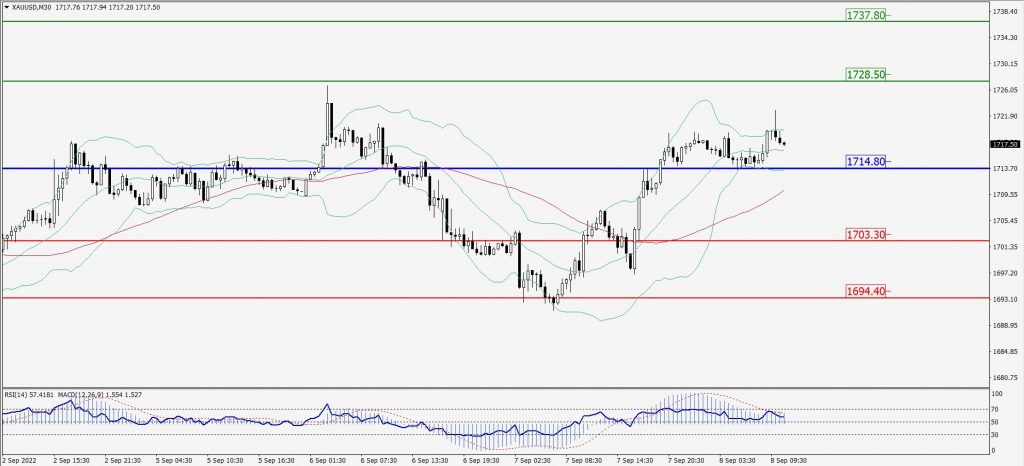
Green Lines Indicate Resistance Levels – Red Lines Indicate Support Levels
Light Blue is a Pivot Point – Black represents the price when the report was produced
Dow Jones Intraday: Resistance level at 31,669.00
Our pivot point is 31,669.00
Preferable Price Action: Take sell positions below pivot with targets at 31,249.00 & 30,977.00.
Alternative Price Action: Above 31,669.00 looks for further upside to 32,044.00 & 32,291.00.
Comment: RSI at 50 levels and Pairs below 20MA.
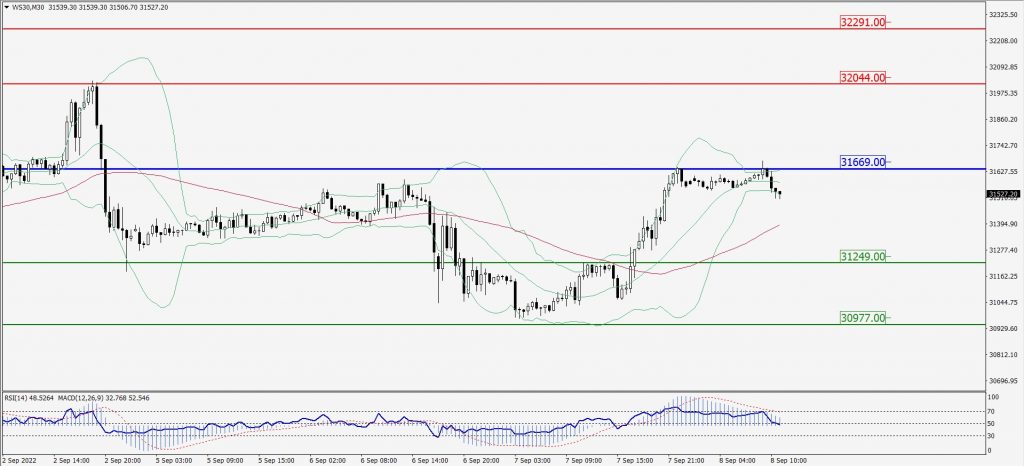
Green Lines Indicate Resistance Levels – Red Lines Indicate Support Levels
Light Blue is a Pivot Point – Black represents the price when the report was produced