Market Wrap: Stocks, Bonds, Commodities
A late rally helped the S&P 500 snap a four-session losing skid on Thursday with investor focus turning to a key report on the labor market on Friday.
The Dow Jones Industrial Average rose 145.99 points to 31,656.42, the S&P 500 gain 11.85 points to 3,966.85 and the Nasdaq Composite subtract 31.08 points to 11,785.13.
MSCI’s index of Asia-Pacific stocks outside Japan is drop 0.64% to 624.87 levels. Australian index lower 0.25% to 6,828.70. Japanese Nikkei Index drop 0.04% to 27,650.84.
European stocks were positive on Friday, with the Stoxx Europe 50 Index rose 0.79% to 3,483.95, Germany’s DAX ascend 1.29% to 12,793.58, and France’s CAC add 0.72% to 6,078.51, and U.K.’s FTSE 100 surged 0.60% to 7,191.41.
Benchmark 10-year U.S. Treasury fell as demand for safe assets ascend again, today 10-year bond yields a negative 0.29% to 3.2560.
Oil prices climbed on Friday on bets that OPEC+ will discuss output cuts at a meeting on September 5, but the benchmarks were still on track to post their worst weekly drop in four on fears Covid-19 curbs in China and weak global growth will hit demand.
Spot Brent crude oil add 2.17% to $94.39 per barrel. US West Texas Intermediate crude is up 2.34% to $88.62 a barrel.
The yellow metal gold is advance 0.27% to 1,713.00 dollars per ounce.
Market Wrap: Forex
The U.S. dollar edged lower in early European trade Friday, but remained near a two-decade high ahead of the widely watched monthly U.S. jobs report which could point to further hefty interest rate hikes.
Today, the U.S. dollar index measures the Greenback against a trade-weighted basket of six major currencies, which is fell 0.29% to 109.343.
The Euro US Dollar (EUR/USD) is a widely traded pair that is up 0.43% today. This left the pair trading around $0.99860.
The Japanese yen was positive against the U.S. dollar on Friday as the stock up. Today USD/JPY is ascend 0.06% to 140.300 level.
Another commodity-related currency positive against the U.S dollar, AUD/USD surged 0.29% to 0.68040, and NZD/USD up 0.02 to 0.60800 level.
EUR/USD Intraday: Trend on the upside
Our pivot point is at 0.99810
Preferable Price Action: Take buy positions above pivot level with targets at 1.00330 & 1.00710 in extension.
Alternative Price Action: Below pivot looks for a further downside to 0.99360 & 0.99040.
Comment: RSI above 50 levels and Pairs above its 20MA & 55MA.
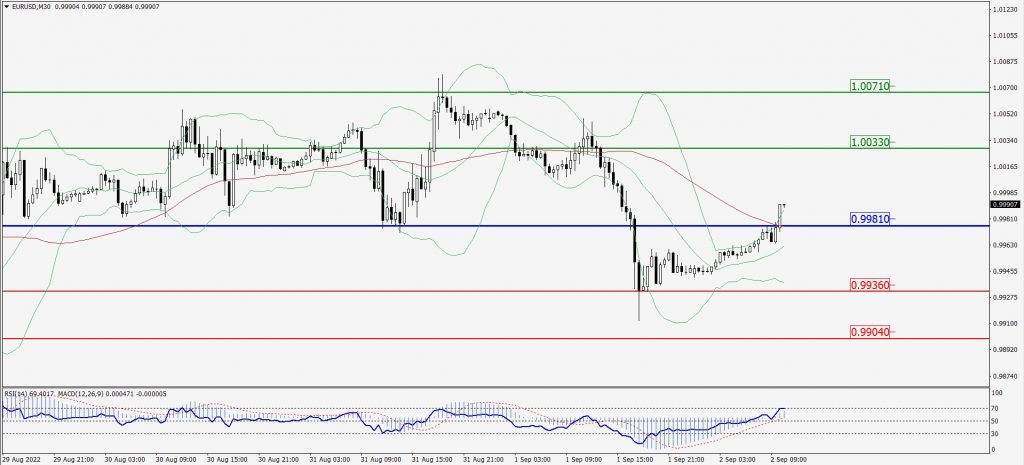
Green Lines Indicate Resistance Levels – Red Lines Indicate Support Levels
Light Blue is a Pivot Point – Black represents the price when the report was produced
GBP/USD Intraday: Support level at 1.15460
Our pivot point is at 1.15460
Preferable Price Action: Buy positions above pivot with targets at 1.16610 & 1.17520 in extension.
Alternative Price Action: The price below pivot would call for further downside to 1.14450 & 1.13730.
Comment: RSI above 50 levels and Pairs above its 20MA & 55MA.
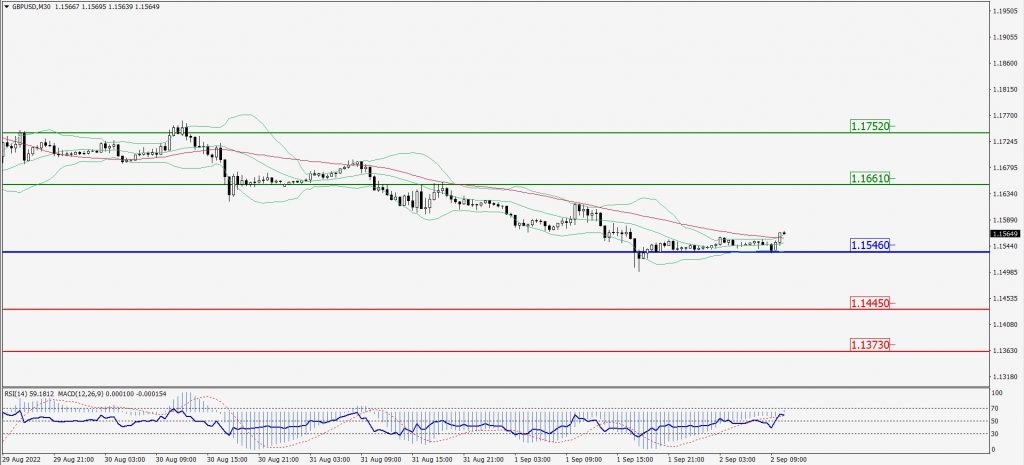
Green Lines Indicate Resistance Levels – Red Lines Indicate Support Levels
Light Blue is a Pivot Point – Black represents the price when the report was produced
USD/JPY Intraday: Trend on the upside
Our pivot point is at 140.020
Preferable Price Action: Buy position above pivot with the target at 140.940 and 141.580 in extension.
Alternative Price Action: The downside breakout of the pivot would call for 139.250 and 138.720.
Comment: MACD is positive territory and Pairs above 55MA.
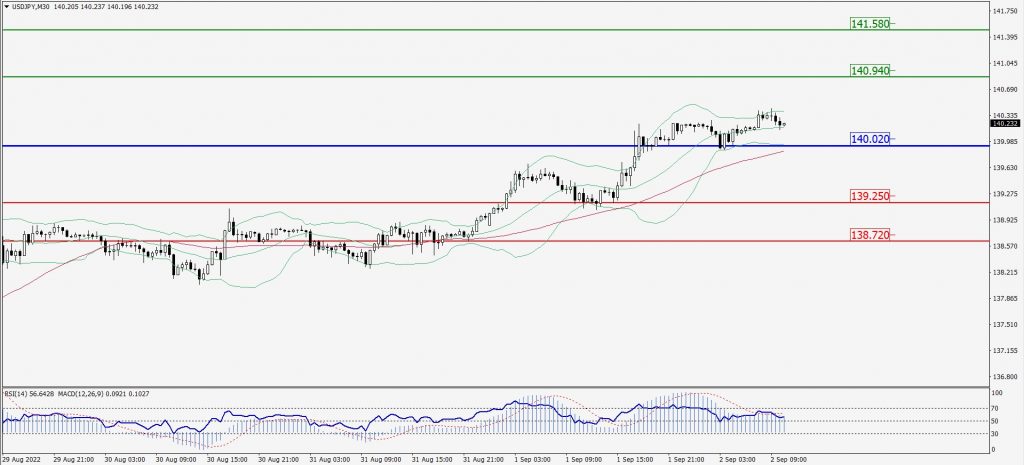
Green Lines Indicate Resistance Levels – Red Lines Indicate Support Levels
Light Blue is a Pivot Point – Black represents the price when the report was produced
AUD/USD Intraday: In a consolidation zone
Our pivot point is at 0.68120
Preferable Price Action: Sell Positions below pivot with targets at 0.67600 & 0.67200 in extension.
Alternative Price Action: Above pivot looks for a further upside with 0.68570 & 0.68960 as targets.
Comment: RSI at 50 levels and Pairs below 55MA.
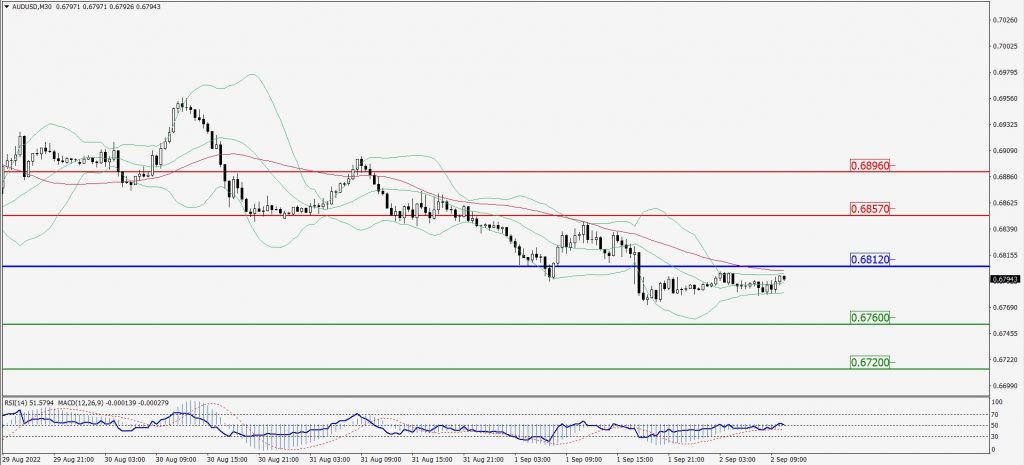
Green Lines Indicate Resistance Levels – Red Lines Indicate Support Levels
Light Blue is a Pivot Point – Black represents the price when the report was produced
CRUDEOIL Intraday: Trend on the upside
Our pivot point is at 87.54
Preferable Price Action: Above pivots buy oil with 90.06 & 92.11 as targets.
Alternative Price Action: Sell crude below pivot with targets at 85.39 and 83.46 in extension.
Comment: MACD is in the positive territory and Pairs above its 20MA & 55MA.
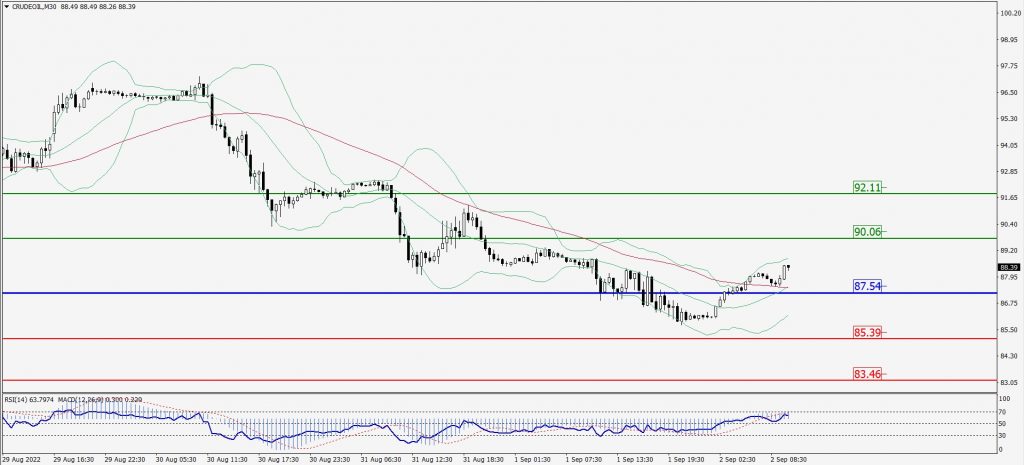
Green Lines Indicate Resistance Levels – Red Lines Indicate Support Levels
Light Blue is a Pivot Point – Black represents the price when the report was produced
XAU/USD Intraday: Support level at 1698.30
Our pivot point is 1698.30
Preferable Price Action: Further upside to 1718.80 and 1734.20
Alternative Price Action: If the price gives a downside breakout of a pivot, then the price extends to 1681.70 and 1668.10.
Comment: MACD is positive territory and Pairs above its 20MA & 55MA.
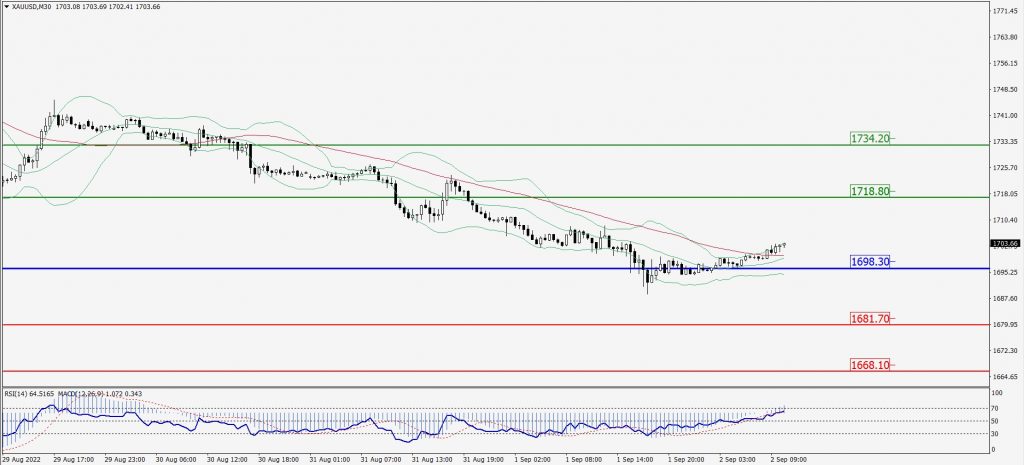
Green Lines Indicate Resistance Levels – Red Lines Indicate Support Levels
Light Blue is a Pivot Point – Black represents the price when the report was produced
Dow Jones Intraday: In a consolidation zone
Our pivot point is 31,543.00
Preferable Price Action: Take buy positions above pivot with targets at 31,745.00 & 31,886.00.
Alternative Price Action: Below 31,543.00 looks for further downside to 31,375.00 & 31,243.00.
Comment: RSI at 50 levels and Pairs above 55MA.
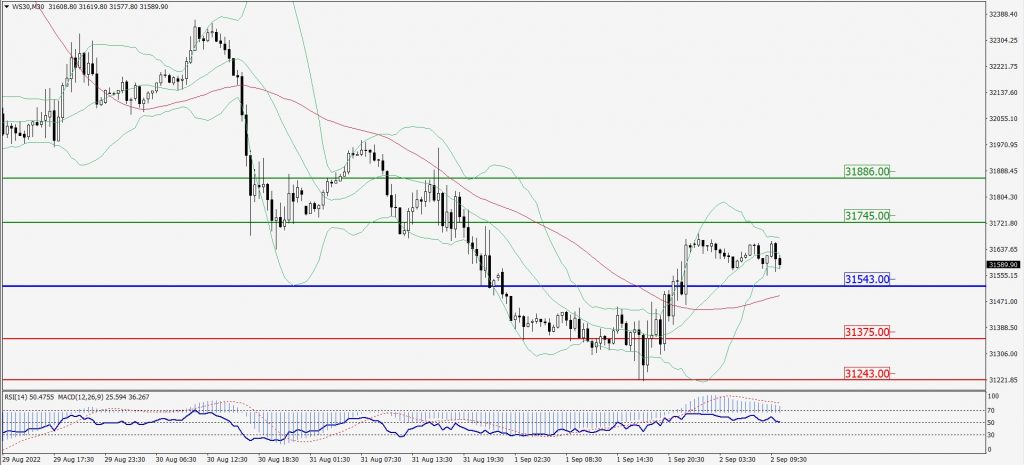
Green Lines Indicate Resistance Levels – Red Lines Indicate Support Levels
Light Blue is a Pivot Point – Black represents the price when the report was produced