Market Wrap: Stocks, Bonds, Commodities
The US stocks fell and the dollar rose on Friday, even as Treasury yields gained, with traders anxious about inflation and what the Federal Reserve will do to combat it.
The Dow Jones Industrial Average fell 292.30 points to 33,706.74, the S&P 500 lose 55.26 points to 4,228.48 and the Nasdaq Composite subtract 260.13 points to 12,705.21.
MSCI’s index of Asia-Pacific stocks outside Japan is drop 0.99% to 636.49 levels. Australian index lower 0.95% to 7,046.90. Japanese Nikkei Index drop 0.47% to 28,794.50.
European stocks were negative on Monday, with the Stoxx Europe 50 Index fell 1.81% to 3,662.95, Germany’s DAX decline 1.87% to 13,290.60, and France’s CAC drop 1.80% to 6,378.85, and U.K.’s FTSE 100 sliped 0.70% to 7,498.00.
Benchmark 10-year U.S. Treasury fell as demand for safe assets ascend again, today 10-year bond yields a positive 1.12% to 2.9560.
Oil prices slumped on Monday, ending three days of gains, as investors were concerned aggressive U.S. interest rate hikes will weaken the global economy and dent fuel demand while a strengthening dollar also added to pressure.
Spot Brent crude oil down 1.95% to $94.80 per barrel. US West Texas Intermediate crude is down 1.98% to $88.63 a barrel.
The yellow metal gold is decline 0.81% to 1,748.70 dollars per ounce.
Market Wrap: Forex
The U.S. dollar climbed to fresh highs Monday, with Federal Reserve policymakers retaining a hawkish stance over monetary policy ahead of the central bank’s key Jackson Hole symposium later this week.
Today, the U.S. dollar index measures the Greenback against a trade-weighted basket of six major currencies, which is rose 0.16% to 108.270.
The Euro US Dollar (EUR/USD) is a widely traded pair that is down 0.04% today. This left the pair trading around $1.00080.
The Japanese yen was positive against the U.S. dollar on Monday as the stock up. Today USD/JPY is drop 0.10% to 136.820 level.
Another commodity-related currency positive against the U.S dollar, AUD/USD gain 0.38% to 0.68960, and NZD/USD up 0.45 to 0.61980 level.
EUR/USD Intraday: Trend on the downside
Our pivot point is at 1.00340
Preferable Price Action: Take sell positions below pivot level with targets at 0.99590 & 0.98980 in extension.
Alternative Price Action: Above pivot looks for a further upside to 1.01060 & 1.01590.
Comment: RSI below 50 levels and Pairs below its 20MA & 55MA.
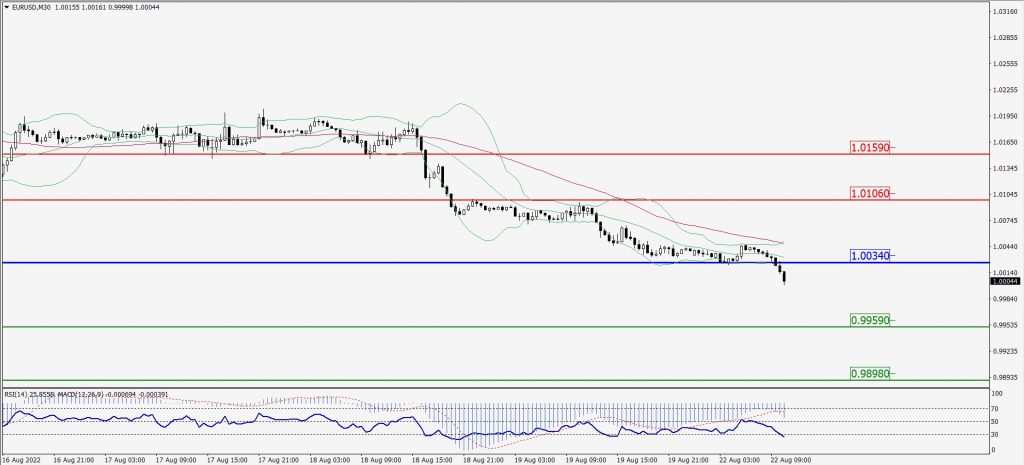
Green Lines Indicate Resistance Levels – Red Lines Indicate Support Levels
Light Blue is a Pivot Point – Black represents the price when the report was produced
GBP/USD Intraday: Resistance level at 1.18450
Our pivot point is at 1.18450
Preferable Price Action: Sell positions below pivot with targets at 1.17310 & 1.16500 in extension.
Alternative Price Action: The price above pivot would call for further upside to 1.19490 & 1.20350.
Comment: RSI below 50 levels and Pairs below its 20MA & 55MA.
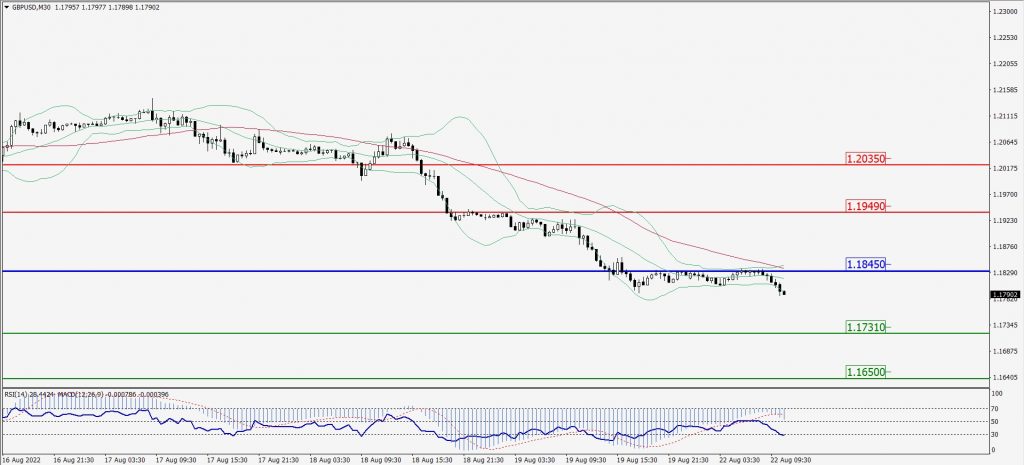
Green Lines Indicate Resistance Levels – Red Lines Indicate Support Levels
Light Blue is a Pivot Point – Black represents the price when the report was produced
USD/JPY Intraday: Trend on the downside
Our pivot point is at 137.220
Preferable Price Action: Sell position below pivot with the target at 136.240 and 135.550 in extension.
Alternative Price Action: The upside breakout of the pivot would call for 138.150 and 138.890.
Comment: MACD is negative territory and Pairs below its 20MA & 55MA.
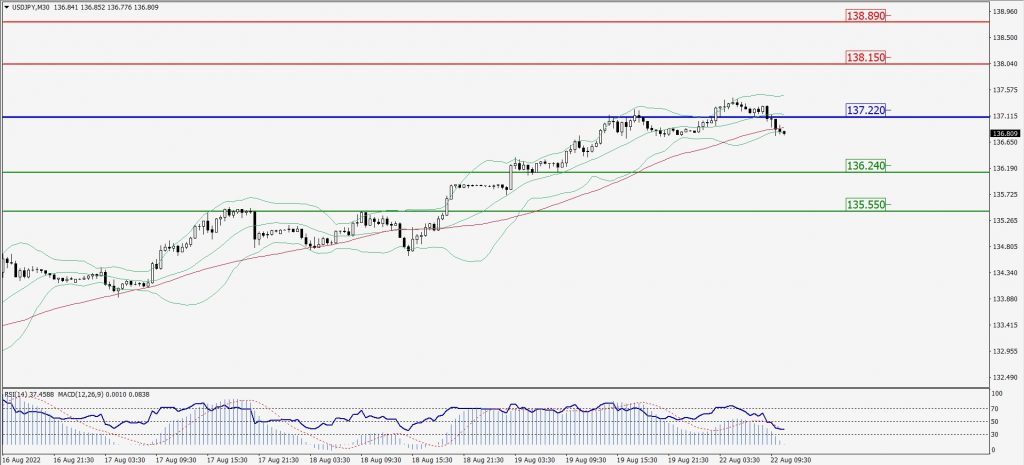
Green Lines Indicate Resistance Levels – Red Lines Indicate Support Levels
Light Blue is a Pivot Point – Black represents the price when the report was produced
AUD/USD Intraday: Resistance level at 0.69110
Our pivot point is at 0.69110
Preferable Price Action: Sell Positions below pivot with targets at 0.68190 & 0.67560 in extension.
Alternative Price Action: Above pivot looks for a further upside with 0.69930 & 0.70550 as targets.
Comment: RSI below 50 levels.
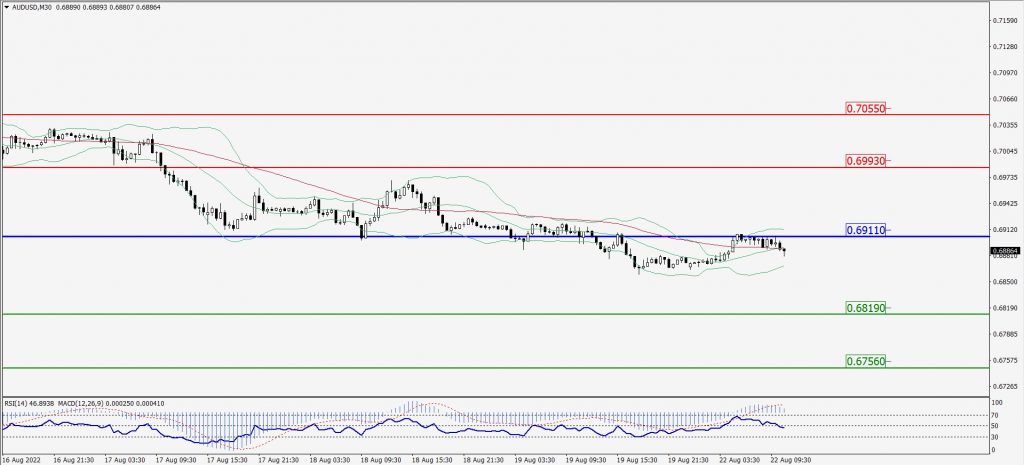
Green Lines Indicate Resistance Levels – Red Lines Indicate Support Levels
Light Blue is a Pivot Point – Black represents the price when the report was produced
CRUDEOIL Intraday: Trend on the downside
Our pivot point is at 89.46
Preferable Price Action: Below pivots sell oil with 87.26 & 85.63 as targets.
Alternative Price Action: Buy crude above pivot with targets at 91.91 and 93.93 in extension.
Comment: MACD is in the negative territory and Pairs below its 20MA & 55MA.
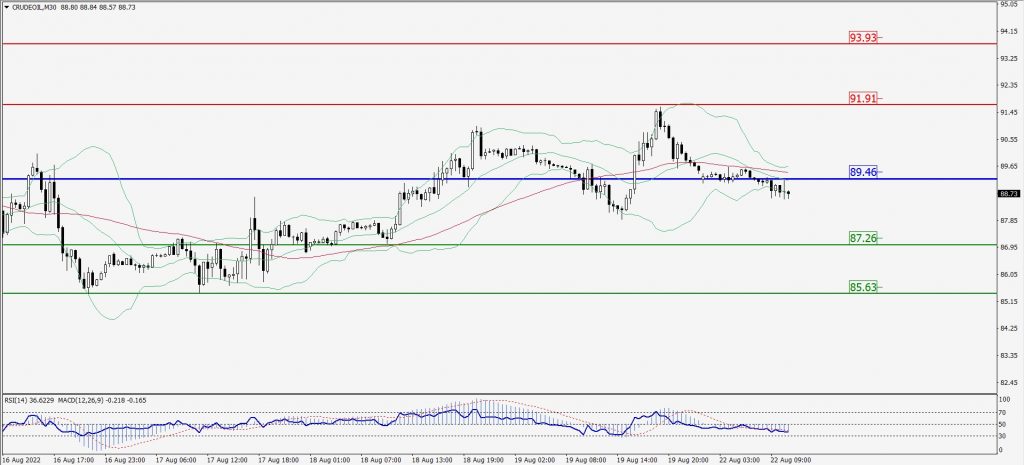
Green Lines Indicate Resistance Levels – Red Lines Indicate Support Levels
Light Blue is a Pivot Point – Black represents the price when the report was produced
XAU/USD Intraday: Major trend on the downside
Our pivot point is 1745.10
Preferable Price Action: Further downside to 1728.50 and 1716.40
Alternative Price Action: If the price gives an upside breakout of a pivot, then the price extends to 1760.50 and 1773.20.
Comment: MACD is negative territory and Pairs below its 20MA & 55MA.
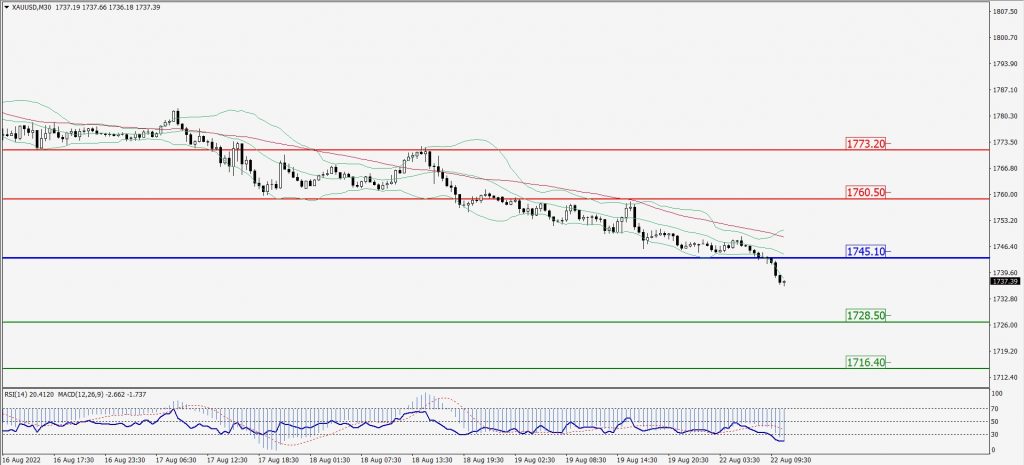
Green Lines Indicate Resistance Levels – Red Lines Indicate Support Levels
Light Blue is a Pivot Point – Black represents the price when the report was produced
Dow Jones Intraday: Trend on the downside
Our pivot point is 33,591.00
Preferable Price Action: Take sell positions below pivot with targets at 33,240.00 & 33,012.00.
Alternative Price Action: Above 33,591.00 looks for further upside to 33,880.00 & 34,127.00.
Comment: RSI below 50 levels and Pairs below its 20MA & 55MA.
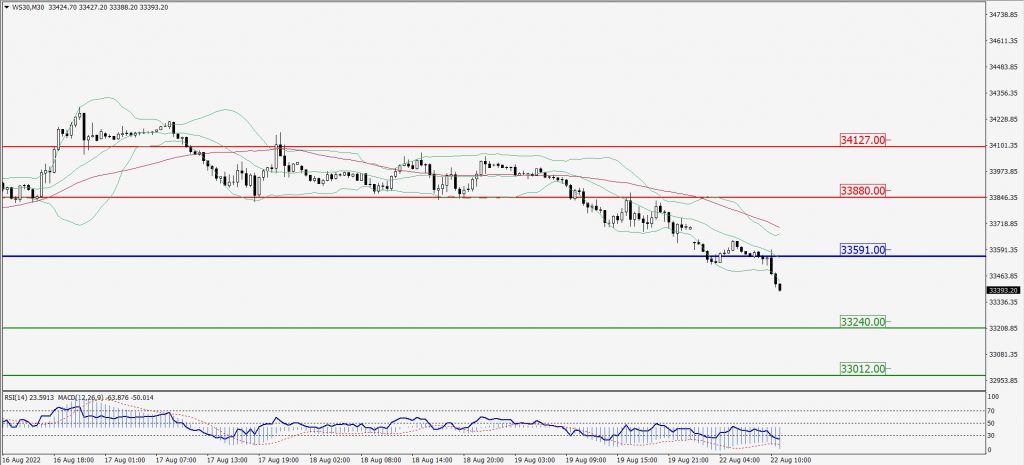
Green Lines Indicate Resistance Levels – Red Lines Indicate Support Levels
Light Blue is a Pivot Point – Black represents the price when the report was produced